
How many recurring pest-control plans are needed to break even?
The reference needs 490.29 paid plans, or 491 whole plans, for cash-after-maintenance break-even. At 550 plans and $60 realized monthly yield, it models $3,203 monthly cash after maintenance. The useful limit is the 618-plan launch target ceiling, not the looser 921-plan mature average: initial service loads the first customer cohort.
What you will produce: Contribution per plan-month, monthly operating results, exact and whole-plan break-even, mature and launch capacity, and a twelve-month service-and-cash schedule using the same assumptions.
Updated October 1, 2026 · Worked examples and editable worksheets
What to have ready
Bring the plan terms, net monthly collections, cohort retention, routine and initial visit records, callbacks, consumables, processing charges, paid roster, route time, standing costs and opening acquisition pace.
Work through the calculation and decision
Start with a billable plan-month
Count one property and accepted recurring scope for the month it is billable under the contract. Use realized monthly yield after discounts, credits, refunds and failed collections; then deduct processing costs once. No separate initial-service fee is assumed here. Annual prepayments require deferred service and refund tracking.
Convert the plan base into service obligations
At steady state, 550 plans and 2% monthly churn require 11 replacement starts. The remaining 539 plans produce 179.67 routine visits at four annual visits per plan. A 3% monthly callback assumption adds 16.5 returns. Fractions describe average workload across cohorts; the actual calendar must assign whole visits at the promised intervals.
Keep treatment decisions separate from the billing calendar
A recurring promise can include inspections, monitoring, prevention and warranted action. EPA describes integrated pest management as a sequence of identification, prevention and control decisions. A monthly charge or scheduled inspection does not itself justify applying a pesticide.
Price every visit type without double-counting payroll
The scenario assigns $12 consumables to a routine visit, $20 to an initial visit, $8 to a callback and 3% of net plan revenue to processing. All paid field, dispatch and management wages stay in monthly payroll. At the default mix, direct cost is $6.36 per plan-month and contribution is $53.64.
Choose the cost boundary before reading break-even
EBITDA covers the loaded paid roster, occupancy and standing costs. Cash after maintenance adds the maintenance reserve. EBIT instead deducts depreciation. Calculate whole-plan thresholds by rounding the exact result up; none of the three is a personal-income or debt-service result.
Make the first customer cohort fit
The seven-step ramp reaches 40%, 55%, 70%, 82%, 90%, 96% and 100% of the target, then holds it. Each month retains prior plans after churn and adds enough new plans to meet that month's target. New initial visits replace their routine allocation. The additional consumables cost equals $15.68 per net added plan at the defaults.
Test the limiting route month
The default mature ledger uses 219.83 field hours, but the first month uses 311.95 hours to onboard 220 plans. At these timings, mature capacity is 921 plans while the launch target cap is 618. A larger route cannot be promised merely because a mature average fits; seasonality, access and actual service cohorts can bind sooner.
Test a lower yield before relying on the surplus
As a conditional sensitivity, $43 monthly yield with the same visits, consumables, paid roster and standing costs leaves $37.15 contribution per plan and needs 707.92 plans for cash break-even. That exceeds the 618-plan launch target ceiling. The $43 value corresponds to a named Sacramento provider's advertised starting offer, whose scope and terms differ; this calculation does not predict that provider's costs or results.
Use the sensitivity to choose the next test
Change net monthly yield, churn, visit frequency, callback burden, visit duration and the cost structure independently. A lower yield changes contribution; more churn changes both initial-service cost and hours. If the threshold exceeds physical capacity, revise scope, price, territory or commitments before acquiring more plans.
The disclosed plan and service workload
This is an authored operating scenario. Occupation wages are observed anchors; commercial price, demand, costs, retention, visit frequency and duration remain assumptions.
| Input or result | Basis | Reference |
|---|---|---|
| Active paid plans | Assumed mature scenario | 550 per month |
| Realized monthly yield | Assumed, after discounts/refunds/failed collection; before processing | $60 per plan-month |
| Routine / initial / callback consumables | Assumed service costs, excluding payroll | $12 / $20 / $8 per visit |
| Scheduled visits / churn / callbacks | Assumed service and retention behavior | 4 per year / 2% per month / 3% of active plans per month |
| Loaded paid roster | Derived from occupation wage anchors plus assumed employer allowance | $16,299 per month |
| Occupancy / other standing cost / maintenance | Assumed commercial costs | $1,600 / $7,400 / $1,000 per month |
| Monthly plan revenue | Derived from the stated assumptions | $33,000 |
| Variable service and processing cost | Derived from the stated assumptions | $3,498 |
| Contribution | Derived from the stated assumptions | $29,502 |
| Cash after maintenance | Derived from the stated assumptions | $3,203 |
| Cash break-even | Derived from the stated assumptions | 490.29 plans; 491 whole plans |
| Mature / launch-target capacity | Derived from the stated assumptions | 921 / 618 plans |
What this changes: A recurring plan count is usable only when its initial, routine and callback obligations fit qualified paid capacity and customers pay the realized yield.
Test recurring pest plans, visit obligations, break-even and route capacity
Start with the illustrative example, then replace its inputs with your own assumptions. All money amounts are in USD. The result updates in this tab.
Illustrative result · assumptions apply
- Realized monthly yield per paid plan
- $60.00
- Steady service and processing cost per plan-month
- $6.36
- Contribution per plan-month
- $53.64
- Mature monthly plan revenue
- $33,000.00
- Mature monthly service and processing costs
- $3,498.00
- Mature monthly contribution
- $29,502.00
- Loaded monthly paid roster
- $16,299.26
- Mature monthly EBITDA
- $4,202.74
- Mature monthly cash after maintenance
- $3,202.74
- Mature monthly EBIT
- $2,969.41
- Exact EBITDA break-even plans
- 471.65 plans
- Whole EBITDA break-even plans
- 472 plans
- Exact cash-after-maintenance break-even plans
- 490.29 plans
- Whole cash-after-maintenance break-even plans
- 491 plans
- Exact depreciation-inclusive EBIT break-even plans
- 494.64 plans
- Whole depreciation-inclusive EBIT break-even plans
- 495 plans
- Mature monthly routine visits
- 179.67 visits
- Mature monthly replacement initial visits
- 11 visits
- Mature monthly callbacks
- 16.5 visits
- Mature monthly field hours including nonroute work
- 219.83 hours
- Mature unused paid field hours; negative means overbooked
- 126.84 hours
- Highest monthly field hours during the launch ramp
- 311.95 hours
- Steady-state whole-plan field capacity
- 921 plans
- Launch-ramp whole-plan target capacity
- 618 plans
- Entered whole-plan management ceiling
- 618 plans
- Lower launch-and-mature target-plan capacity
- 618 plans
- Capacity minus whole cash break-even; negative means infeasible
- 127 plans
- Capacity minus whole EBIT break-even; negative means infeasible
- 123 plans
- Additional onboarding consumables per net plan added
- $15.68
- First-year cash after maintenance before receivable changes
- -$19,459.48
Whole-plan cash break-even fits inside the entered physical target capacity. Income is measured in paid plan-months; initial, routine and callback visits are service obligations. Fractional visits represent aggregate averages, not partial treatments. The twelve-month ramp assumes 40%, 55%, 70%, 82%, 90%, 96% and then 100% of the entered target. The schedule excludes opening payments, receivable changes, financing, income tax and distributions. Use the business or state funding calculator for opening cash. These are assumptions, not observed demand.
| Month | Paid plans | Initial visits | Routine visits | Callbacks | Field hours | Revenue (USD) | Direct costs (USD) | Cash after maintenance (USD) |
|---|---|---|---|---|---|---|---|---|
| 1 | 220 | 220 | 0 | 6.6 | 311.95 | $13,200.00 | $4,848.80 | -$17,948.06 |
| 2 | 302.5 | 86.9 | 71.87 | 9.08 | 212.11 | $18,150.00 | $3,217.50 | -$11,366.76 |
| 3 | 385 | 88.55 | 98.82 | 11.55 | 240.29 | $23,100.00 | $3,742.20 | -$6,941.46 |
| 4 | 451 | 73.7 | 125.77 | 13.53 | 247.46 | $27,060.00 | $3,903.24 | -$3,142.50 |
| 5 | 495 | 53.02 | 147.33 | 14.85 | 242.01 | $29,700.00 | $3,838.12 | -$437.38 |
| 6 | 528 | 42.9 | 161.7 | 15.84 | 243.04 | $31,680.00 | $3,875.52 | $1,505.22 |
| 7 | 550 | 32.56 | 172.48 | 16.5 | 240.31 | $33,000.00 | $3,842.96 | $2,857.78 |
| 8 | 550 | 11 | 179.67 | 16.5 | 219.83 | $33,000.00 | $3,498.00 | $3,202.74 |
| 9 | 550 | 11 | 179.67 | 16.5 | 219.83 | $33,000.00 | $3,498.00 | $3,202.74 |
| 10 | 550 | 11 | 179.67 | 16.5 | 219.83 | $33,000.00 | $3,498.00 | $3,202.74 |
| 11 | 550 | 11 | 179.67 | 16.5 | 219.83 | $33,000.00 | $3,498.00 | $3,202.74 |
| 12 | 550 | 11 | 179.67 | 16.5 | 219.83 | $33,000.00 | $3,498.00 | $3,202.74 |
Complete your decision record
Contribution per plan-month, monthly operating results, exact and whole-plan break-even, mature and launch capacity, and a twelve-month service-and-cash schedule using the same assumptions. Enter the finding or number, the source and the next action for each row. “Supported” records your assessment of that item; it does not approve the business or certify completed research.
| Item and what to record | Your finding and evidence | Status and next action |
|---|---|---|
| Plan baseBeginning plans, retained plans, canceled plans, new starts, active billable months and realized collections | ||
| Service obligationsRoutine inspections, initial visits, callbacks, covered scope and completed documentation | ||
| Paid capacityOn-property time, drive/access, records, stocking, training, vehicle care and blocked visits | ||
| Unit costsConsumables by visit type, processing fees and supplier terms, separate from payroll | ||
| Cash timingMonthly earned income, prepayments, refunds, receivables, collection dates, opening payments and reserve |
5 items have no evidence recorded yet.
Entries are temporary and are not sent to us or saved automatically. Download your completed work before leaving or refreshing this page.
Choose your next action
| If your finding is… | Your next action |
|---|---|
| Cash break-even exceeds the launch ceiling | Reduce fixed commitments or change supported yield, service scope, territory or paid capacity before selling the required plan count. |
| The first cohort uses more time than the mature route | Slow the acquisition ramp, schedule lawful capacity or change the initial-service scope; do not book simultaneous work for the same technician. |
| Churn or callbacks rise | Recompute both visit costs and hours; a flat active-plan count can hide expensive replacement sales and repeat service. |
Errors that can change the result
- Counting quarterly service visits as if each were a new monthly subscription.
- Charging collection loss a second time after using net realized yield.
- Adding a routine visit for the same new customer whose initial service already substitutes for it that month.
- Using the mature route ceiling to promise an untested first-month onboarding load.
- Treating aggregate fractional visits as a literal diary or a margin as owner pay.
Apply this to your business
These operating formats match the decisions in this guide.
Pest Control Company
Local recurring residential general-household pest service company with two paid field technicians, two service vehicles, paid dispatch and paid owner-manager replacement-cost coverage
Open the operating guide and state profiles →Carry retained plan income, the full visit mix, paid capacity and the opening ramp into the national plan and state reference scenario. Values entered here are not automatically transferred to another calculator.
Continue with the next part of your plan
- How to control pest-service dispatch, compliance and retention
An accepted-scope intake, dispatch-readiness check, paid route ledger, documented service closure, callback cause record and cohort retention decision.
- How to price a service and cover the work behind it
A tested price, contribution per completed sale and the sales needed to cover monthly fixed costs.
- How to build a staffing roster before estimating payroll
A roster with complete task coverage and an annualized monthly staffing budget.
- How to build a startup budget you can actually fund
A funding total, a dated payment ledger and a clear amount still to arrange.
Sources and limits
The sources below provide the stated background. The worked examples, calculator defaults and decision exercises are authored teaching material. They do not establish market prices, local demand, legal applicability or completed state research.
- Pest Control Company reference economics
Authored recurring-plan and paid-visit scenario; not observed performance.
- BLS May 2025 Occupational Employment and Wage Estimates
Broad wage anchors for the stated paid roster, not recruiting quotes or proof of applicator eligibility.
- EPA integrated pest management principles
Inspection, identification, prevention and warranted control decisions; not a mandatory application calendar.
- CalPro Pest Control: advertised residential plans
Sacramento provider's Gold offer from $43 monthly for quarterly service, with its own scope and payment terms. A starting offer is not realized yield, a statewide average or evidence of the provider's profitability.
- SBA: planning a business
Background on costs, demand and break-even.
Source pages checked October 1, 2026. Research and review standards · Report an issue
When you need a longer financial plan
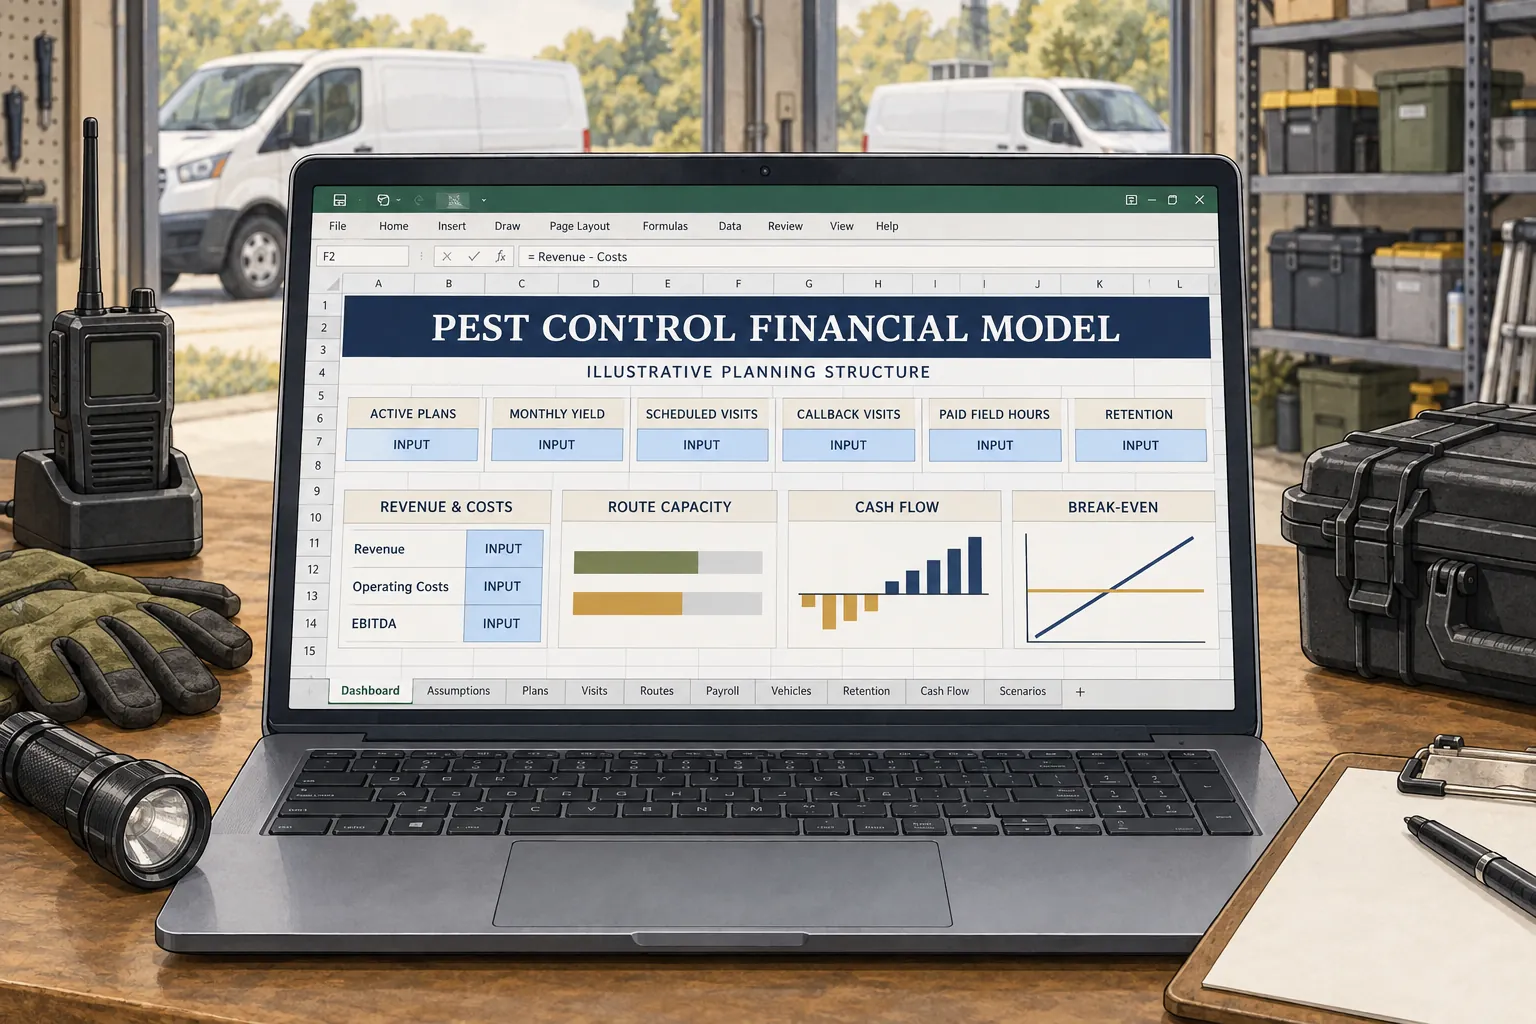
Use a financial model to organize a broader forecast after defining your own operating assumptions. The site’s research, your worksheet entries and any purchased workbook are separate; entries are not transferred automatically.
Continue with the published financial scenario