
How many sold technician hours does an auto repair shop need to break even?
Build realized labor revenue from completed repair orders, sold technician hours per order, and the achieved effective labor rate. Add realized parts sales from the same orders, then subtract parts cost, direct consumables, sublet work, payment fees, and a disclosed warranty and rework allowance. Compare contribution with operating EBITDA before maintenance, operating cash after maintenance, and depreciation-inclusive EBIT. Finally, test whether the resulting repair-order and sold-hour threshold fits both productive technician-hours and usable bay-hours.
What you will produce: Labor revenue, parts revenue, contribution per repair order, three labeled monthly results, break-even repair orders and sold hours for each boundary, technician-hour gap, bay-hour gap, lower physical capacity, and the signed gap between physical capacity and EBIT break-even.
Updated September 28, 2026 · Worked examples and editable worksheets
What to have ready
Bring closed repair-order records, customer authorizations, labor operations, sold and clock hours, realized labor revenue, parts sales and cost, freight, cores, returns, supplier credits, direct consumables, sublet work, payment costs, warranty and rework, paid roster, employer allowance, occupancy, standing costs, maintenance, depreciation, available technician-hours, bay-hours, parts-waiting time, equipment downtime, and collection dates.
Work through the calculation and decision
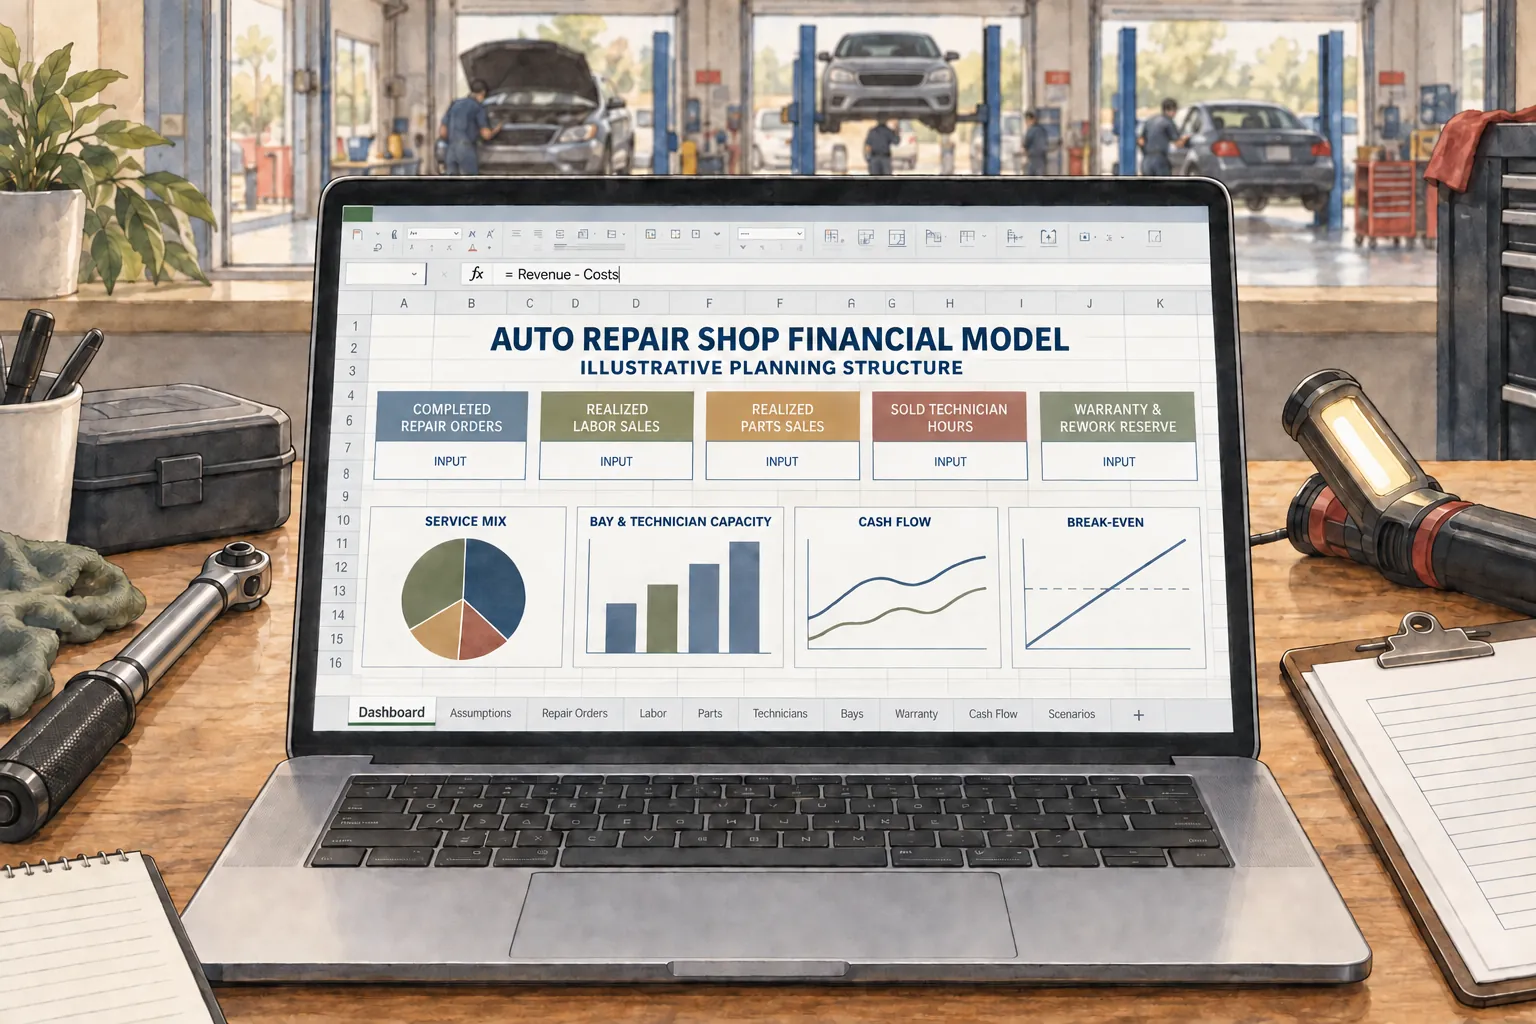
What counts as a completed repair order?
Count one repair order when the authorized included work, required quality-control step, and customer or vehicle handoff satisfy the stated completion and revenue policy. Keep appointment, estimate, authorization, deposit, parts order, work in process, declined work, unpaid balance, warranty return, refund, and chargeback separate.
Keep complaint, diagnosis, labor operations, sold and clock hours, bay-hours, parts, direct costs, invoice, collection, quality control, warranty, and rework attached to the same order. Use an average only after the underlying closed-order records remain visible.
How should labor and parts enter break-even?
Calculate labor revenue from realized sold hours and the achieved effective labor rate. Calculate parts revenue and parts cost from the same completed-order mix. Keep paid technician wages in monthly payroll rather than counting them again as a direct cost per order.
Compare monthly contribution with three explicit boundaries. Operating EBITDA excludes the separate maintenance reserve and depreciation. Operating cash after maintenance adds the reserve. Depreciation-inclusive EBIT adds depreciation instead. Owner withdrawals, debt service, income tax, major replacement, and unentered costs remain outside all three.
Why must technician and bay capacity be tested separately?
Deduct training, meetings, documentation, cleanup, maintenance, warranty work, rework, and entered idle time from paid technician-hours. Reconcile bay-hours after inspection, staging, parts waiting, quality control, cleaning, equipment downtime, and rework. A profitable repair-order count is infeasible when either system cannot deliver it.
Compare exact and whole-order break-even with the lower physical ceiling. Preserve the signed gaps instead of silently reducing entered demand. Investigate authorization, diagnosis, parts availability, clock time, bay dwell, quality control, and warranty causes when actual usage exceeds the plan.
The reference mix produces $47,410.00 of monthly contribution before the paid roster and standing costs
This authored scenario uses 110 completed repair orders, 2.50 sold labor hours per order, a $145.00 realized labor rate per sold hour, and $275.00 of realized parts revenue per order. Repair-order volume, labor realization, parts mix and cost, bay time, rework, premises, and collection are planning assumptions rather than observed national or local performance.
| Input or result | Calculation | Reference |
|---|---|---|
| Realized labor revenue per order | 2.50 sold hours × $145.00 | $362.50 |
| Realized parts revenue per order | Entered parts sales attached to the same completed order | $275.00 |
| Revenue per completed repair order | $362.50 labor + $275.00 parts | $637.50 |
| Contribution per completed repair order | $637.50 revenue − $206.50 entered variable cost | $431.00 |
| Monthly contribution | 110 completed orders × $431.00 | $47,410.00 |
| Operating EBITDA | $47,410.00 − $36,008.72 boundary | $11,401.28 |
| Cash after maintenance | $47,410.00 − $38,508.72 boundary | $8,901.28 |
| Depreciation-inclusive EBIT | $47,410.00 − $38,592.05 boundary | $8,817.95 |
| Cash break-even repair orders | $38,508.72 ÷ $431.00 = 89.35; round up | 90 orders |
| Cash break-even sold hours | 89.35 orders × 2.50 sold hours | 223.37 sold hours |
| Entered physical ceiling | Lower calculated resources, capped by the research-bound management ceiling | 122 orders |
| Capacity gap versus whole cash break-even | 122 − 90 | 32 orders |
What this changes: The authored plan places cash-after-maintenance break-even 32 whole repair orders below the entered 122-order ceiling. Replace completed orders, sold and clock hours, effective labor rate, parts economics, bay dwell, parts delays, warranty and rework, premises, and collection with actual records before making a commitment.
Test Auto Repair Shop sold hours, break-even, technician time and bay capacity
Start with the illustrative example, then replace its inputs with your own assumptions. All money amounts are in USD. The result updates in this tab.
Illustrative result · assumptions apply
- Realized labor revenue per completed repair order
- $362.50
- Realized total revenue per completed repair order
- $637.50
- Parts cost per completed repair order
- $165.00
- Payment cost per completed repair order
- $14.02
- Warranty and rework allowance per completed repair order
- $11.48
- Contribution per completed repair order
- $431.00
- Monthly labor revenue
- $39,875.00
- Monthly parts revenue
- $30,250.00
- Monthly completed-order revenue
- $70,125.00
- Monthly direct parts, supplies, sublet, payment and warranty cost
- $22,715.00
- Monthly contribution
- $47,410.00
- Loaded monthly payroll
- $17,808.72
- Operating EBITDA cost boundary
- $36,008.72
- Cash-after-maintenance cost boundary
- $38,508.72
- Depreciation-inclusive EBIT cost boundary
- $38,592.05
- Monthly operating EBITDA result
- $11,401.28
- Monthly cash result after maintenance
- $8,901.28
- Monthly depreciation-inclusive EBIT result
- $8,817.95
- Exact EBITDA break-even repair orders
- 83.55 orders
- Whole EBITDA break-even repair orders
- 84 orders
- Exact cash break-even repair orders
- 89.35 orders
- Whole cash break-even repair orders
- 90 orders
- Exact EBIT break-even repair orders
- 89.54 orders
- Whole EBIT break-even repair orders
- 90 orders
- Cash break-even sold technician-hours
- 223.37 sold hours
- Entered warranty or rework incidents
- 4.4 incidents
- Productive technician-hours after nonrepair and rework time
- 310.07 technician-hours
- Direct clock technician-hours required
- 275 technician-hours
- Remaining technician-hour capacity; negative means overbooked
- 35.07 technician-hours
- Productive bay-hours after blocked and rework time
- 528 bay-hours
- Direct bay-hours required
- 352 bay-hours
- Remaining bay-hour capacity; negative means overbooked
- 176 bay-hours
- Technician-supported whole-order capacity
- 124 orders
- Bay-supported whole-order capacity
- 165 orders
- Entered management whole-order ceiling
- 122 orders
- Lower physical whole-order capacity
- 122 orders
- Physical capacity minus whole EBIT break-even
- 32 orders
Whole-order EBIT break-even fits inside the entered technician, bay and management capacity. Sold hours, paid clock hours and bay-hours remain separate. An estimate, deposit, parts order, open invoice or warranty return is not another completed repair order. Paid roster wages remain in monthly payroll and are not counted again per order. This is an authored scenario, not observed demand or a guarantee.
Complete your decision record
Labor revenue, parts revenue, contribution per repair order, three labeled monthly results, break-even repair orders and sold hours for each boundary, technician-hour gap, bay-hour gap, lower physical capacity, and the signed gap between physical capacity and EBIT break-even. Enter the finding or number, the source and the next action for each row. “Supported” records your assessment of that item; it does not approve the business or certify completed research.
| Item and what to record | Your finding and evidence | Status and next action |
|---|---|---|
| Repair-order ledgerOrder ID, vehicle, complaint, diagnosis, estimate, authorization, labor operations, sold hours, clock hours, bay-hours, parts, sublet work, invoice, collection, quality control, warranty, and rework | ||
| Paid capacityTechnician-hours and bay-hours by diagnosis, authorized repair, quality control, cleanup, training, meetings, parts waiting, maintenance, idle time, and rework | ||
| Parts and direct costParts sales and cost, freight, cores, returns, obsolete stock, supplier credits, consumables, sublet work, payment cost, and warranty recovery | ||
| Cost boundaryLoaded payroll, occupancy, standing costs, maintenance reserve, depreciation, and selected exclusions | ||
| DecisionSelected financial boundary, repair-order and sold-hour threshold, technician gap, bay gap, and the next price, mix, process, quality, capacity, or funding test |
5 items have no evidence recorded yet.
Entries are temporary and are not sent to us or saved automatically. Download your completed work before leaving or refreshing this page.
Choose your next action
| If your finding is… | Your next action |
|---|---|
| Break-even exceeds technician capacity | Change labor rate, order mix, direct cost, nonrepair time, rework, roster, or commitments before adding demand. |
| Break-even exceeds bay capacity | Change vehicle flow, parts staging, authorization, bay dwell, equipment uptime, rework, accepted scope, or premises plan before promising the work. |
| The result works only with an unsupported parts margin or effective labor rate | Retest actual closed repair orders and customer authorizations rather than treating a posted rate or markup policy as achieved revenue. |
Errors that can change the result
- Counting an estimate, deposit, open repair order, warranty return, or rework visit as another completed repair order.
- Counting paid technician wages in monthly payroll and again as a direct cost per repair order.
- Treating posted labor rate, parts markup, sold hours, or three open bays as achieved contribution or demand.
- Calling an operating result owner income, debt capacity, or investment payback.
Apply this to your business
These operating formats match the decisions in this guide.
Auto Repair Shop
Independent three-bay general automotive repair shop with two full-time paid automotive service technicians plus one full-time paid owner-manager/service-advisor replacement-cost role, ordinary diagnostic and mechanical-repair equipment, and a defined passenger-car and light-truck scope
Open the operating guide and state profiles →Carry the completed-order policy, sold hours, labor rate, parts mix, technician and bay capacity, warranty and rework, and selected cost boundary into the opening plan and state reference pages. Values entered here are not automatically transferred to another calculator.
Continue with the next part of your plan
- How to plan service bays, parts delays, warranty work, and rework
A weekly technician-and-bay board, repair-order readiness check, sold-hour and clock-hour reconciliation, parts and core record, vehicle-flow plan, quality-control record, warranty and rework ledger, and conditional decision about price, accepted scope, staffing, equipment, parts policy, or premises commitment.
- How to compare equipment quotes and build the opening budget
A comparable two-quote cost calculation and a supplier commitment record.
- How to build a startup budget you can actually fund
A funding total, a dated payment ledger and a clear amount still to arrange.
- How to build a staffing roster before estimating payroll
A roster with complete task coverage and an annualized monthly staffing budget.
- How to price a service and cover the work behind it
A tested price, contribution per completed sale and the sales needed to cover monthly fixed costs.
Sources and limits
The sources below provide the stated background. The worked examples, calculator defaults and decision exercises are authored teaching material. They do not establish market prices, local demand, legal applicability or completed state research.
- U.S. Census Bureau: 2022 NAICS 811111 General Automotive Repair
Official industry definition. It includes employer shops of many sizes and service mixes and does not establish local demand, a repair-order ticket, startup cost or three-bay profitability.
- BLS May 2025 Occupational Employment and Wage Estimates
Cross-industry wage anchors for automotive technicians and first-line repair supervisors. They are not recruiting quotes, flat-rate plans, owner draws or complete employer costs.
- EPA: managing used oil for businesses
Federal used-oil handling background. State and local rules, the selected waste stream, customer authorization, specialty work and vendor pricing still require exact checks.
- Auto Repair Shop reference economics and definitions
The site-authored three-bay scenario and its disclosed assumptions; it is not observed national or local performance.
Source pages checked September 28, 2026. Research and review standards · Report an issue
When you need a longer financial plan
Use a financial model to organize a broader forecast after defining your own operating assumptions. The site’s research, your worksheet entries and any purchased workbook are separate; entries are not transferred automatically.