How to test a coffee shop location by buying window
Turn timed location observations into a transaction scenario, check service capacity and build a comparable site-evidence record.
Work through the guide →
Choose a frontage and a drink-and-food mix that can earn repeat transactions during usable buying windows and pay for the entire counter day. The stated national wage scenario uses 160 orders per trading day at $8.50 per order, producing $4,867 mature monthly EBIT and $145,986 modeled opening funding. Sales, capacity and nonwage costs remain planning assumptions.

Measure the morning and afternoon separately. A daily order total can look achievable while the espresso, payment or pickup station prevents the needed peak transactions.
One completed transaction carries the realized drink-and-food basket. Two drinks on one ticket remain one order; food attachment changes the basket and its preparation load.
At the assumed activity, the mature month produces $6,234 EBITDA, $4,867 EBIT and $5,984 cash after maintenance. The first twelve modeled months generate $32,832 of operating cash; they do not represent a full year at the mature run rate.
The EBIT threshold is approximately 126.63 orders per trading day; it uses the same price, variable-cost basis and complete paid roster. The listed ceiling is 240 orders per trading day, with the operating qualifications in the capacity explanation below. Run an ordinary peak order sequence through payment, beverage production, food handoff and cleanup. Test queue loss and staffing by interval, rather than multiplying a best minute across the day.
| Test | Entered activity or cost | Monthly EBIT |
|---|---|---|
| Published reference | 160 orders per trading day | $4,867 |
| 20% less earned activity | 128 orders per trading day | $200 |
| 10% higher wage benchmarks | 1.10 × the same occupational wage anchors | $3,687 |
| 20% higher occupancy cost | $3,600.00 monthly occupancy | $4,267 |
Of the three separate tests shown, 20% less earned activity makes the largest change to monthly EBIT: -$4,668. This is a result of the stated test sizes, not a probability or a universal risk ranking.
The paid counter team and management cover setup, deliveries, service, cleaning and closing as well as the visible rush. Tips do not reduce the modeled wage bill.
Opening payments of $98,224, the deepest cumulative operating cash deficit of $13,554 in month 3, and the retained buffer of $34,208 add to $145,986 modeled funding. Refundable deposits are included in opening cash uses; they are not operating expenses. Funding is a scenario total, not a quote or a financing recommendation.
Prompt retail receipts can support working cash, but espresso equipment, services and fit-out still precede those receipts. Opening cash recovery and a profitable mature month answer different questions.
EBITDA pays the full modeled roster and operating costs. EBIT also deducts depreciation. Mature cash deducts maintenance investment from EBITDA, after receivables stop growing. All three exclude financing, income taxes and additional owner distributions.
If the transactions needed at the realized basket do not fit the observed buying windows and counter throughput, revise the offer or location before accepting higher occupancy cost. Observe relevant traffic during the intended hours, test conversion with paid orders and time the realized basket before quoting the bar layout and utility installation.
The wage observation is the BLS May 2025 national occupational median for each stated role. Hours, employer allowance, sales, prices, capacity and all nonwage costs are authored assumptions. Read the calculation definitions.
Calculations retain the exact input values. USD totals are displayed to whole dollars and blended prices to cents; activity and threshold estimates are displayed to up to two decimals. Rounded thresholds are estimates, not prescriptions for a sufficient whole job, visit or member count.
The modeled unit is a paid transaction. A second drink on one ticket raises the basket but is not a second customer transaction. Separate drink mix, food attachment and discounts when checking the realized ticket.
Habit can support frequent visits, but convenient access, reliable opening hours and fast fulfillment must earn that habit. Observe return visits rather than assuming every nearby worker becomes a regular.
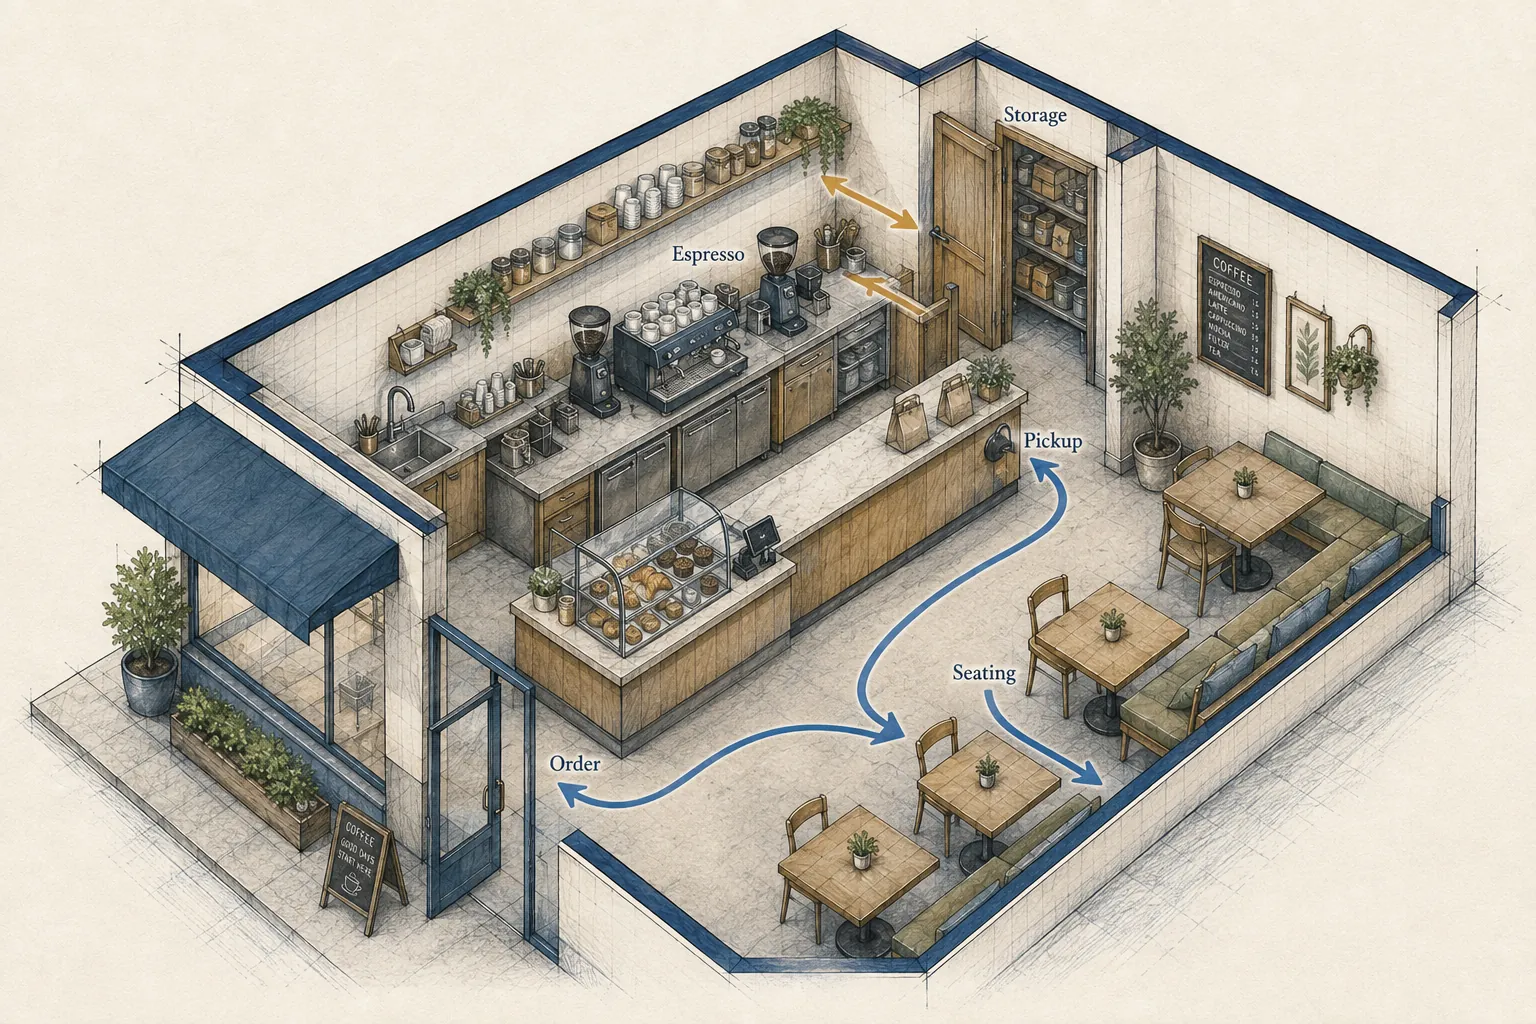
| Format | What changes | How to use it |
|---|---|---|
| Neighborhood coffee shop | Counter service, drinks and a limited food offer | The reference format used here; the busiest hour can constrain the day. |
| Kiosk or cart | A smaller work area with a tightly defined menu | Power, water, storage, weather exposure and site permissions need a different plan. |
| Café with a full kitchen | Food production as well as drinks | Adds preparation, equipment and staffing demands beyond this reference. |
A founder who enjoys frequent customer interaction, consistent routines and managing a short, intense service peak. The work includes early preparation, cleaning and stock control as well as making drinks.
The figures below are a national wage reference scenario. The paid roster uses May 2025 BLS national occupational medians. Prices, customer volume, rent, equipment and other commercial inputs are authored assumptions. This is not a researched average startup cost, owner-income promise or a funding recommendation.
| Input or result | Reference | What to verify |
|---|---|---|
| Completed sales units | 4,160 orders / month | 160 orders per trading day; demand requires evidence. |
| Net selling price | $8.50 | Build and test a relevant local menu, package or contract scope. |
| Revenue | $35,360 | Calculated volume × price, not observed sales. |
| Paid payroll | $11,804 / month | National wage medians × the stated hours × the 18% employer allowance. |
| Opening payments | $98,224 | Authored equipment and setup allowances, deposit and paid training. |
| Funding including reserve | $145,986 | Opening payments + deepest modeled operating deficit + retained buffer. |
| Mature operating profit (EBIT) | $4,867 / month | After the full paid roster and depreciation; before financing and income taxes. |
| Approximate EBIT threshold | Approximately 126.6 orders per trading day | A rounded estimate. Test whole permitted activity against the full roster and resource constraints. |
30 orders per hour × 8 selling hours = 240 orders per day. This assumes a workable bar layout; actual morning peaks need a queue and staffing check.
30% drinks, bought-in food and waste plus 4% payment processing and disposables. Utilities $700; insurance $350; marketing $500; software, cleaning and other operating costs $750 per month.
BLS does not publish a separate barista occupation in this selection. Fast Food and Counter Workers is a broad proxy. The model does not subtract anticipated customer tips.
BLS May 2025 national wage workbook · Calculation definitions · How owner income differs from EBIT
| Workstream | What the brief needs | Decision before spending |
|---|---|---|
| Coffee production | Espresso capacity, grinders, filtration, service access and commissioning | Match equipment to simultaneous orders, not just a daily cup target. |
| Counter and premises | Water, drainage, power, customer queue and pickup flow | Check the actual space before ordering equipment. |
| Stock and refrigeration | Milk, coffee, food, packaging and reorder frequency | Use the proposed menu and spoilage pattern to set opening quantities. |
Compare installed scope, exclusions and payment dates. Do not treat an unquoted item as zero or count a bundled installation twice. How to compare equipment quotes and build the opening budget explains a reusable quote ledger.
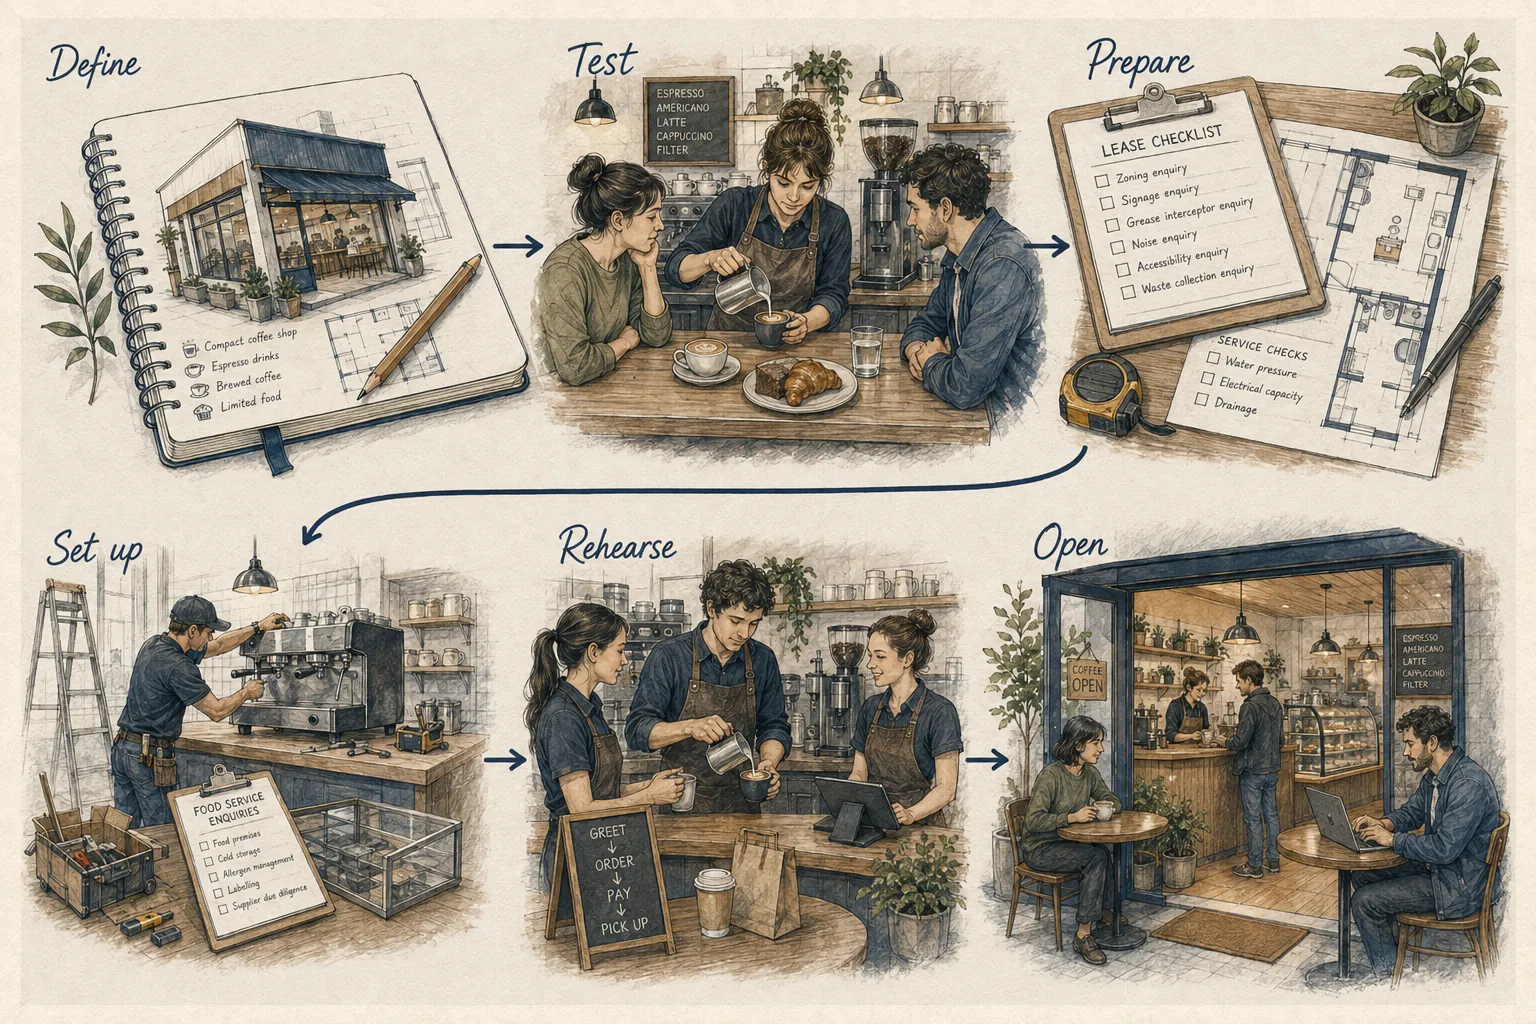
Count relevant passing traffic by time and direction over different days. Record access, competing queues and nearby closures. A total daily pedestrian count hides the morning constraint.
Price a short menu and calculate a weighted ticket from observed or explicitly assumed item mix. Include packaging, payment fees, waste and promotional discounts.
Run a practice order sequence, including food, substitutions, payment and cleanup. Identify the slowest station and translate it into realistic peak throughput.
Roster opening, deliveries, peaks and closing. A quiet extra hour still uses paid time and utilities; compare its contribution with the extra work before extending the day.
| Measure | Why it changes a decision |
|---|---|
| Transactions by half hour | Tests whether the daily target fits the actual demand windows. |
| Net ticket and food attachment | Distinguishes higher prices from a different basket mix. |
| Order-to-handoff time | Reveals capacity and service problems that can interrupt repeat visits. |
| Milk, food waste and paid hours | Shows whether a busy counter produces sufficient contribution after labor. |
Review actuals against the scope you priced. If an extra service, new trading hour or more distant client changes the work, update the roster and contribution calculation before expanding.
Describe drink preparation, on-site food handling, water supply, seating, signage and outdoor service. Ask the address-level authorities which food, building, fire and other approvals apply to that exact scope.
Each state profile links to official registration, tax and employer routes, together with the questions still requiring an address-specific answer. How to find the permits and approvals your business actually needs provides the record to keep.
A location justified only by annual footfall, a sales plan that ignores peak queues, or a ticket based on a premium drink that few people buy can make a busy-looking shop miss its financial threshold.
Write a response that changes the actual cause: narrower scope, a different site, revised paid staffing, a tested price or a delayed opening. A larger cash buffer only addresses a temporary timing gap.
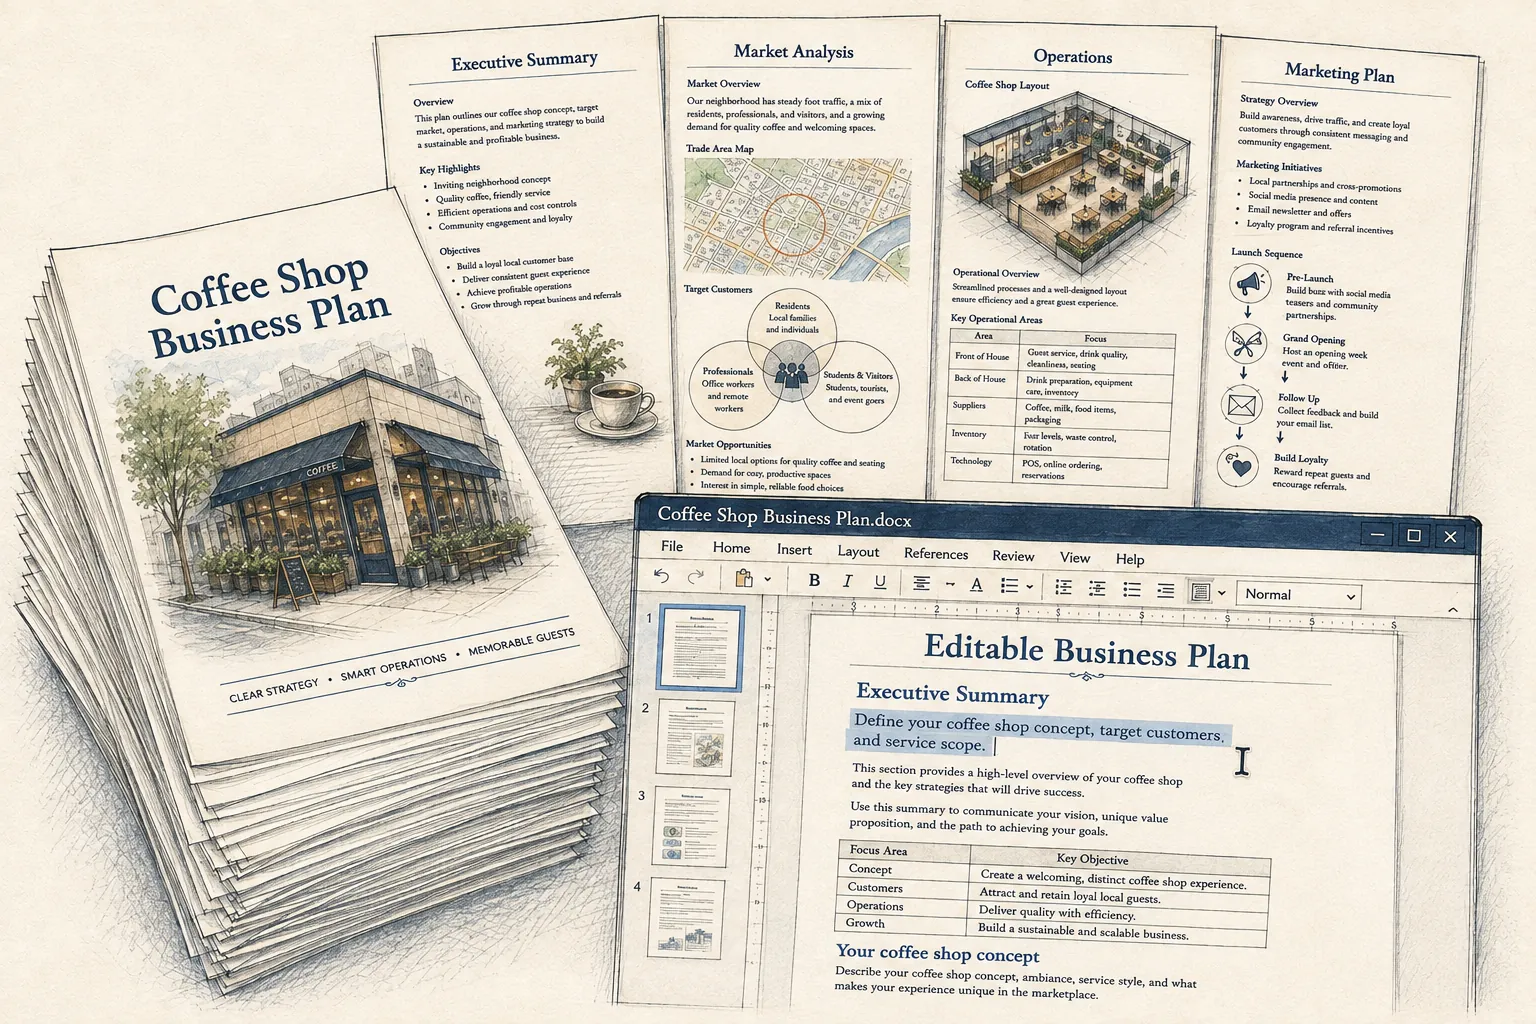
Turn timed location observations into a transaction scenario, check service capacity and build a comparable site-evidence record.
Work through the guide →Compare total occupancy cash, upfront commitments and site dependencies using a worked premises budget and a practical review record.
Work through the guide →Design a small paid demand test, separate enquiries from completed sales and calculate acquisition cost for the same customer cohort.
Work through the guide →Calculate contribution, the price required at realistic sales volume and the number of completed services needed to cover fixed costs.
Work through the guide →Choose between a meal-led service operation and a habit-led counter operation. The counter-service restaurant reference must coordinate menu production, guest ordering and dining space; a coffee shop must win repeat transactions and deliver them quickly in its buying windows.
Compare the operating choices →A coffee shop wins short, frequent customer transactions at a location. A recurring cleaning business wins a defined monthly obligation at client sites. Compare buying windows with route capacity, and immediate customer collections with invoice timing.
Compare the operating choices →The core difference is a transaction queue versus an appointment diary. Coffee depends on fast fulfillment during buying peaks; a salon depends on skilled hours, service duration and kept appointments. Both need repeat customers, but their scheduling and hiring problems differ.
Compare the operating choices →A coffee shop serves many short transactions; a detailing studio serves fewer jobs that occupy technicians and space for longer. The practical choice depends on whether you can establish a buying location or a reliable package-and-booking operation.
Compare the operating choices →A coffee shop depends on frequent purchases in short buying windows. A laundromat depends on less frequent household visits with longer dwell time and a machine mix that can serve peak loads.
Compare the operating choices →A coffee shop needs many short transactions in defined buying windows. A daycare center needs a smaller number of long-duration reserved care relationships supported by age-group rooms and paid coverage.
Compare the operating choices →A coffee shop needs many short orders in concentrated buying windows. A pet grooming salon needs fewer, longer booked services supported by skilled hands-on time and a sequence of bathing, drying, grooming and handoff resources.
Compare the operating choices →A coffee shop needs many short transactions in defined buying windows at one location. A landscaping company earns fewer, longer property completions across route days. Convenience drives repeat demand in both, but counter throughput and route density are different operating systems.
Compare the operating choices →A Coffee Shop depends on repeat transactions at one frontage; a Food Truck depends on enough completed orders in several lawful service windows. Both face short buying peaks, but mobility changes preparation, access, setup, weather and schedule reliability.
Compare the operating choices →A Coffee Shop relies on rapid drink production and repeat transactions at one frontage. A Bakery relies on whole-batch production and the sell-through of a broader finished-goods range. A limited bought-in food case does not give the Coffee Shop the same production system as an on-site Bakery.
Compare the operating choices →A Coffee Shop depends on many short transactions at one frontage. A Fitness Studio depends on recurring member-months and fewer, longer scheduled classes. Both need repeat local use, but buying-window throughput and membership retention create different capacity and acquisition problems.
Compare the operating choices →A Coffee Shop depends on many short transactions during a few buying windows. An HVAC Company schedules longer technical jobs whose scope can change after diagnosis and whose equipment or parts may be paid before collection. The choice is between counter throughput at one location and field capacity across a route.
Compare the operating choices →A Coffee Shop depends on many short transactions during a few buying windows. A Moving Company depends on fewer jobs whose duration changes with inventory, access, loading, travel, and customer readiness. One manages counter flow and repeat habit; the other protects whole crew-and-truck blocks and custody of customer property.
Compare the operating choices →A Coffee Shop converts short counter transactions into daily volume through bar, queue, and seating capacity. An Auto Repair Shop converts diagnosis, sold labor, parts, and bay time into completed repair orders. Both rely on repeat local customers and a fitted site, but repair orders carry longer authorization, parts, custody, and warranty cycles.
Compare the operating choices →A Coffee Shop earns from completed beverage and food orders through bar, queue, seating, and peak-hour throughput. A Plumbing Company earns from completed and collected residential service jobs through licensed plumbers, two vehicles, dispatch, materials, permits, and callback control. Both must fit paid capacity to realized contribution, while plumbing adds address-to-address travel, trade authority, water and gas system risk, material acquisition, and return-service exposure.
Compare the operating choices →A Coffee Shop earns from completed beverage and food orders through bar, queue, seating, and peak-hour throughput. An Electrical Contractor earns from completed and collected residential service and small-alteration jobs through licensed electricians, two vehicles, dispatch, sold hours, materials, permits, inspections, testing, and rework control. Both must fit paid capacity to realized contribution, while electrical adds address-to-address travel, trade authority, code and energized-work risk, material compatibility, inspection dependencies, and return-service exposure.
Compare the operating choices →Coffee Shop earns from completed beverage and food orders and is constrained by bar, queue, seating, and peak-hour throughput. Pest Control Company earns a monthly household-plan yield while delivering a separate calendar of inspections, initial visits and callbacks. Compare realized contribution and paid capacity in their own units; a pest contract base is useful only when retention, legal scope and route obligations remain deliverable.
Compare the operating choices →Coffee Shop earns from completed counter orders and a realized drink-and-food basket and is constrained by ordering, beverage production and pickup within short buying windows. Residential Remodeling Company earns accepted interior scope, expressed as comparable project equivalents, while controlling a paid carpenter crew and authorized specialty trades. Compare the complete paid operating mechanism and dated cash, using each format’s own unit.
Compare the operating choices →No. The relevant questions are who passes while the shop is open, whether they can stop, their buying occasion and the conversion needed to reach paid transactions.
Test the extra contribution against preparation time, waste, equipment and approvals. More sales categories can slow the drinks operation or require a different business format.
The shop still needs setup, stock handling, cleaning and closing. Leaving those hours unpaid makes the model look more efficient than an operation someone must actually run.
No states match these filters.
Sorting compares one defined format. It does not rank states for attractiveness or prove demand. Funding includes opening payments, the deepest cumulative operating cash deficit in the 60-month model and the retained cash buffer.
| State | Funding scenario | Loaded payroll / month | Approximate EBIT threshold orders per trading day |
|---|---|---|---|
| Alabama | $135,940 | $9,670 | 112 |
| Alaska | $152,958 | $13,137 | 135.8 |
| Arizona | $149,872 | $12,547 | 131.7 |
| Arkansas | $136,106 | $9,709 | 112.3 |
| California | $163,645 | $14,924 | 148 |
| Colorado | $155,825 | $13,669 | 139.4 |
| Connecticut | $154,015 | $13,339 | 137.2 |
| Delaware | $147,902 | $12,170 | 129.1 |
| Florida | $144,682 | $11,555 | 124.9 |
| Georgia | $139,668 | $10,551 | 118 |
| Hawaii | $157,746 | $13,977 | 141.5 |
| Idaho | $143,561 | $11,340 | 123.5 |
| Illinois | $147,247 | $12,045 | 128.3 |
| Indiana | $143,848 | $11,395 | 123.8 |
| Iowa | $141,697 | $10,984 | 121 |
| Kansas | $142,023 | $11,046 | 121.4 |
| Kentucky | $141,510 | $10,948 | 120.8 |
| Louisiana | $134,600 | $9,353 | 109.8 |
| Maine | $150,558 | $12,678 | 132.6 |
| Maryland | $150,136 | $12,597 | 132.1 |
| Massachusetts | $160,487 | $14,417 | 144.5 |
| Michigan | $140,317 | $10,704 | 119.1 |
| Minnesota | $149,902 | $12,552 | 131.8 |
| Mississippi | $133,881 | $9,183 | 108.7 |
| Missouri | $143,645 | $11,356 | 123.6 |
| Montana | $144,445 | $11,509 | 124.6 |
| Nebraska | $140,276 | $10,695 | 119 |
| Nevada | $145,423 | $11,696 | 125.9 |
| New Hampshire | $149,292 | $12,436 | 131 |
| New Jersey | $152,565 | $13,062 | 135.3 |
| New Mexico | $141,534 | $10,953 | 120.8 |
| New York | $156,219 | $13,732 | 139.9 |
| North Carolina | $144,549 | $11,529 | 124.7 |
| North Dakota | $145,660 | $11,741 | 126.2 |
| Ohio | $140,467 | $10,740 | 119.3 |
| Oklahoma | $135,920 | $9,665 | 112 |
| Oregon | $147,961 | $12,181 | 129.2 |
| Pennsylvania | $141,223 | $10,893 | 120.4 |
| Rhode Island | $151,124 | $12,786 | 133.4 |
| South Carolina | $140,511 | $10,750 | 119.4 |
| South Dakota | $140,843 | $10,821 | 119.9 |
| Tennessee | $139,962 | $10,620 | 118.5 |
| Texas | $139,167 | $10,433 | 117.2 |
| Utah | $143,003 | $11,234 | 122.7 |
| Vermont | $154,750 | $13,479 | 138.1 |
| Virginia | $145,361 | $11,684 | 125.8 |
| Washington | $164,357 | $15,038 | 148.8 |
| West Virginia | $135,856 | $9,650 | 111.9 |
| Wisconsin | $140,292 | $10,698 | 119.1 |
| Wyoming | $139,820 | $10,587 | 118.3 |
Published research and calculations support business planning and education. They are not personalized financial, investment, tax or legal advice, and they do not guarantee costs, revenue, profit or financing. Estimates depend on the stated format, location, source periods and assumptions. Check the requirements and commitments that apply to your circumstances.