
How many plumbing service jobs and billable hours are needed to break even?
In the disclosed reference case, cash after maintenance reaches break-even at 80.89 completed and collected jobs per month. At 120 jobs, modeled cash after maintenance is $18,538. The result is feasible only if each completed job realizes the entered $450 service and $200 material revenue and the full work-order clock stays inside 346.67 paid field hours.
What you will produce: Realized revenue and variable cost per completed job, monthly contribution, loaded payroll, three labeled operating results, exact and whole-job break-even thresholds, field-hour capacity, and the signed gap between capacity and each financial boundary.
Updated September 29, 2026 · Worked examples and editable worksheets
What to have ready
Bring completed work orders, service and material revenue, material and job-specific cost, payment loss, callback parts and hours, the complete paid roster, occupancy, standing cost, maintenance, depreciation, paid field hours, non-job time and collection dates.
Work through the calculation and decision
Define one completed and collected job
Count a job only after the authorized included work is complete, required documentation is closed, the invoice follows the stated policy, and collection is recorded. Keep estimates, deposits, material orders, open invoices, callbacks, refunds, and chargebacks separate.
Build realized revenue from two visible parts
Enter realized service revenue and realized material revenue from completed jobs. Do not substitute a posted hourly rate, a material markup rule, or an advertised service price for achieved collected dollars.
Keep direct job cost separate from paid payroll
Materials, job-specific permits and disposal, payment loss, and callback parts reduce contribution. The two plumbers, dispatch coverage, and owner-manager replacement coverage stay in paid monthly payroll.
Test three boundaries
EBITDA covers loaded payroll, occupancy, and standing costs. Cash after maintenance adds the monthly vehicle, tool, and premises reserve. EBIT adds depreciation. The calculator reports each boundary without calling it owner income.
Compare break-even with the field-hour ceiling
The financial answer is useful only when full work-order hours, planned non-job time, callbacks, two vehicles, permits, and materials can support the required job count.
The reference case produces $56,880 of monthly contribution at 120 completed jobs
This authored scenario uses 120 completed and collected jobs, $450 of realized service revenue and $200 of realized material revenue per job. Prices, direct costs, work-order time, premises, vehicles, callbacks and demand remain planning assumptions rather than observed performance.
| Input or result | Basis | Reference |
|---|---|---|
| Completed and collected jobs | Assumed scenario | 120 per month |
| Realized service revenue | Assumed scenario | $450 per job |
| Realized materials revenue | Assumed scenario | $200 per job |
| Variable job cost | Assumed scenario | $176 per job |
| Loaded paid-roster payroll | Derived from May 2025 OEWS medians plus the shared 18% allowance | $21,742 per month |
| Occupancy and other standing cost | Assumed scenario | $14,800 per month |
| Maintenance and replacement allowance | Assumed scenario | $1,800 per month |
| Monthly revenue | Calculated from the disclosed reference inputs | $78,000 |
| Monthly contribution | Calculated from the disclosed reference inputs | $56,880 |
| EBITDA | Calculated from the disclosed reference inputs | $20,338 |
| Cash after maintenance | Calculated from the disclosed reference inputs | $18,538 |
| Cash break-even | Calculated from the disclosed reference inputs | 80.89 jobs; 81 whole jobs |
| Entered field-hour ceiling | Calculated from the disclosed reference inputs | 142 jobs |
What this changes: Cash-after-maintenance break-even rounds to 81 whole jobs, below the entered 142-job ceiling. Replace the commercial assumptions and timing allowances with matched local quotes and actual closed-job records before making a commitment.
Test Plumbing Company completed jobs, break-even and paid field capacity
Start with the illustrative example, then replace its inputs with your own assumptions. All money amounts are in USD. The result updates in this tab.
Illustrative result · assumptions apply
- Realized revenue per completed job
- $650.00
- Materials, job-specific, payment and callback-parts cost per job
- $176.00
- Contribution per completed job
- $474.00
- Monthly completed-job revenue
- $78,000.00
- Monthly variable job cost
- $21,120.00
- Monthly contribution
- $56,880.00
- Loaded monthly payroll
- $21,742.40
- Operating EBITDA cost boundary
- $36,542.40
- Cash-after-maintenance cost boundary
- $38,342.40
- Depreciation-inclusive EBIT cost boundary
- $38,542.40
- Monthly operating EBITDA result
- $20,337.60
- Monthly cash result after maintenance
- $18,537.60
- Monthly depreciation-inclusive EBIT result
- $18,337.60
- Exact EBITDA break-even completed jobs
- 77.09 jobs
- Whole EBITDA break-even completed jobs
- 78 jobs
- Exact cash break-even completed jobs
- 80.89 jobs
- Whole cash break-even completed jobs
- 81 jobs
- Exact EBIT break-even completed jobs
- 81.31 jobs
- Whole EBIT break-even completed jobs
- 82 jobs
- Entered callback incidents
- 6 callbacks
- Callback field hours
- 9 field hours
- Direct full work-order field hours
- 258 field hours
- All entered field hours used
- 297 field hours
- Remaining paid field hours; negative means overbooked
- 49.67 field hours
- Field-hour utilization
- 85.67%
- Field-hour-supported whole-job capacity
- 142 jobs
- Entered management whole-job ceiling
- 142 jobs
- Lower physical whole-job capacity
- 142 jobs
- Physical capacity minus whole cash break-even
- 61 jobs
- Physical capacity minus whole EBIT break-even
- 60 jobs
Whole-job EBIT break-even fits inside the entered field-hour and management capacity. Completed jobs, realized service and material revenue, paid field time and callback recovery remain separate. An inquiry, estimate, dispatch, deposit, material order, open invoice or callback is not another completed and collected job. This is an authored scenario, not observed demand or a guarantee.
Complete your decision record
Realized revenue and variable cost per completed job, monthly contribution, loaded payroll, three labeled operating results, exact and whole-job break-even thresholds, field-hour capacity, and the signed gap between capacity and each financial boundary. Enter the finding or number, the source and the next action for each row. “Supported” records your assessment of that item; it does not approve the business or certify completed research.
| Item and what to record | Your finding and evidence | Status and next action |
|---|---|---|
| DemandInquiries, accepted scope, booked windows, dispatched jobs, completed jobs, invoices, collections, cancellations, refunds | ||
| RevenueRealized service dollars, realized material dollars, discounts, tax treatment, payment loss | ||
| Direct costMaterials, freight, permits, disposal, specialty subcontract, callback parts, supplier credits | ||
| Paid timeField, dispatch, supervision, travel, diagnosis, authorization, supplier stops, documentation, training, callbacks | ||
| CapacityAvailable plumbers, vehicles, tools, materials, permits, promised windows, vehicle downtime |
5 items have no evidence recorded yet.
Entries are temporary and are not sent to us or saved automatically. Download your completed work before leaving or refreshing this page.
Choose your next action
| If your finding is… | Your next action |
|---|---|
| Break-even exceeds field capacity | Change price, service mix, direct cost, work-order time, callback rate, roster or fixed commitments before adding demand. |
| The result depends on an unsupported realized job value | Retest closed and collected work orders rather than treating a posted rate or material markup as achieved revenue. |
| Callback time removes the capacity gap | Reduce new promises and correct the supported recurring cause before expanding volume or territory. |
Errors that can change the result
- Counting inquiries, estimates, deposits, dispatched trucks, open invoices, or callbacks as completed new sales.
- Using a posted hourly rate or materials markup as realized collected revenue.
- Charging plumber wages into each job and again through monthly payroll.
- Testing financial break-even without the full paid-time and vehicle ceiling.
- Calling EBITDA, EBIT, or cash after maintenance owner income, debt capacity, or guaranteed payback.
Apply this to your business
These operating formats match the decisions in this guide.
Plumbing Company
Local residential plumbing service contractor with two full-time paid field plumbers, two service vehicles, paid dispatch coverage, and paid owner-manager and qualifying-contractor replacement-cost coverage
Open the operating guide and state profiles →Carry the completed-job policy, service-and-material mix, paid roster, field-hour ceiling, callbacks, and selected cost boundary into the opening plan and state reference pages. Values entered here are not automatically transferred to another calculator.
Continue with the next part of your plan
- How to plan plumbing dispatch capacity and control callbacks
A dispatch-readiness record, complete field-hour schedule, vehicle and material plan, permit and authorization checkpoints, callback ledger, released-capacity decision and the next territory, scope, staffing, vehicle or promise-window test.
- How to price a service and cover the work behind it
A tested price, contribution per completed sale and the sales needed to cover monthly fixed costs.
- How to build a staffing roster before estimating payroll
A roster with complete task coverage and an annualized monthly staffing budget.
- How to build a startup budget you can actually fund
A funding total, a dated payment ledger and a clear amount still to arrange.
Sources and limits
The sources below provide the stated background. The worked examples, calculator defaults and decision exercises are authored teaching material. They do not establish market prices, local demand, legal applicability or completed state research.
- Plumbing Company reference economics and definitions
The site-authored two-plumber residential service scenario and its disclosed assumptions; it is not observed national or local performance.
- BLS May 2025 Occupational Employment and Wage Estimates
Cross-industry wage anchors for plumbers, customer service representatives and first-line construction supervisors. They are not recruiting quotes, owner distributions or complete employer costs.
- SBA: planning a business
Background on costs, demand and break-even.
Source pages checked September 29, 2026. Research and review standards · Report an issue
When you need a longer financial plan
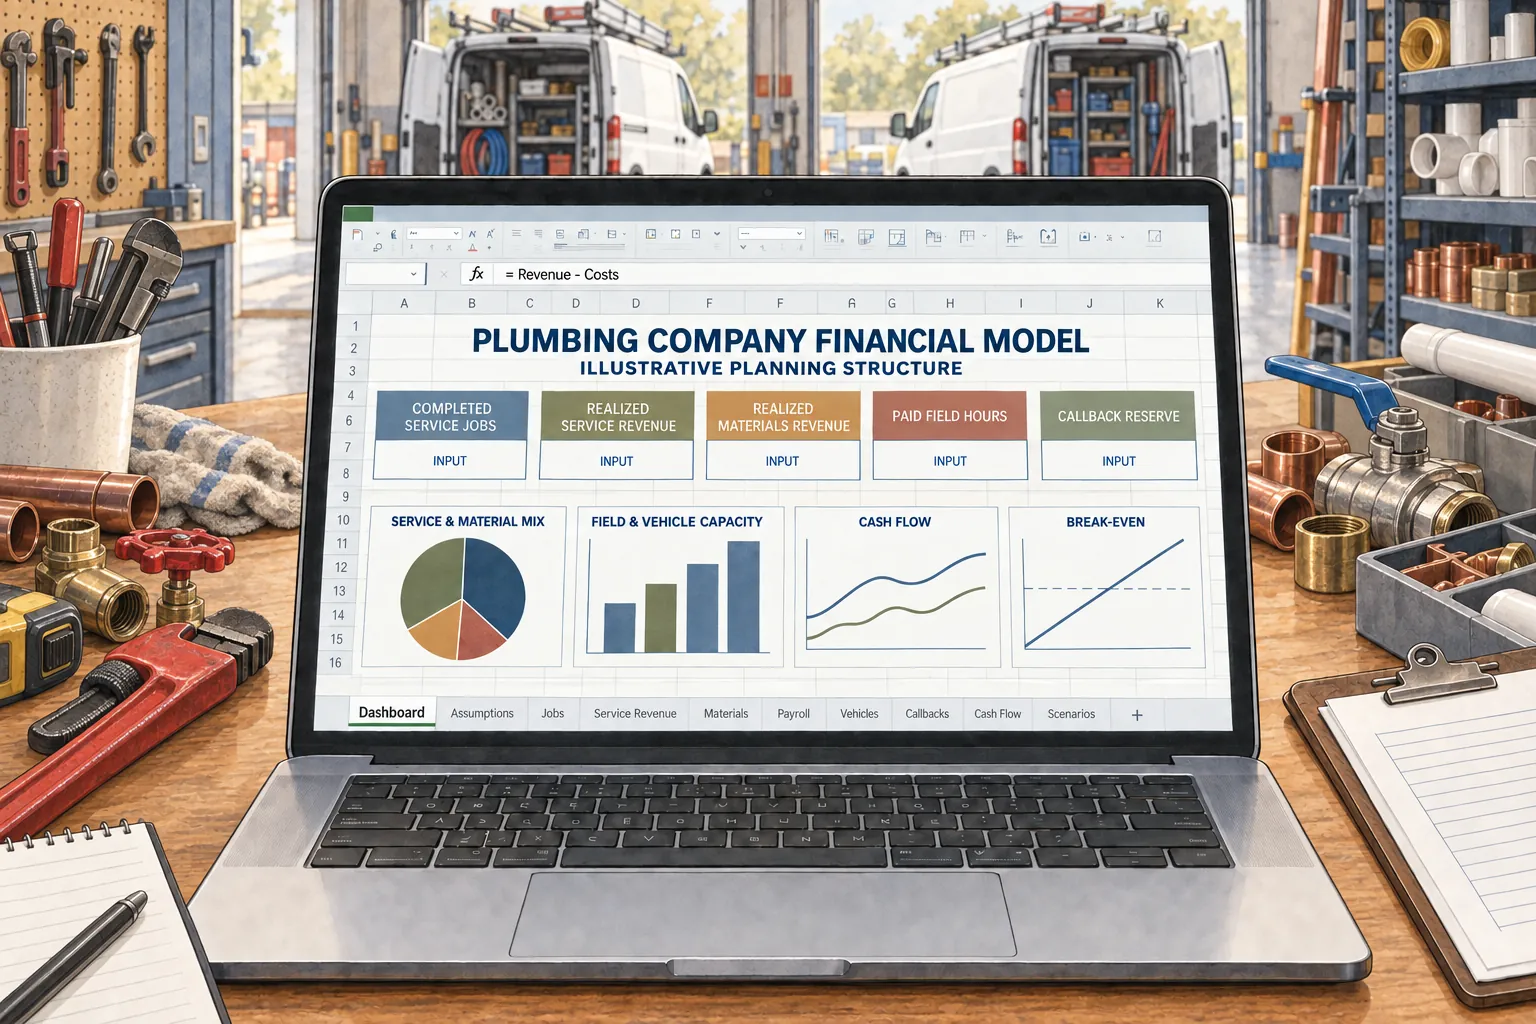
Use a financial model to organize a broader forecast after defining your own operating assumptions. The site’s research, your worksheet entries and any purchased workbook are separate; entries are not transferred automatically.