How to test a restaurant menu before buying more kitchen capacity
Connect recipe cost, sales mix and preparation workload, then identify whether the planned menu fits the available service window.
Work through the guide →
Choose a short menu and a service week that the paid kitchen, counter and cleaning team can deliver before committing to a restaurant lease. The stated national wage scenario uses 100 guests per trading day at $26.00 per guest, producing $3,812 mature monthly EBIT and $315,213 modeled opening funding. Sales, capacity and nonwage costs remain planning assumptions.

The useful operating test is the paid cover pattern across all trading periods. Three theoretical turns on each seat cannot compensate for a quiet lunch or a kitchen that cannot deliver the dinner mix.
A cover is one paying guest at the realized meal check. Separate the number of guests from tickets, dishes, seats and delivery orders.
At the assumed activity, the mature month produces $6,645 EBITDA, $3,812 EBIT and $6,145 cash after maintenance. The first twelve modeled months generate $1,495 of operating cash; they do not represent a full year at the mature run rate.
The EBIT threshold is approximately 91.19 guests per trading day; it uses the same price, variable-cost basis and complete paid roster. The listed ceiling is 144 guests per trading day, with the operating qualifications in the capacity explanation below. Time the slowest kitchen station and the guest path during the busiest meal period. Validate table turnover and the complete paid shift before relying on the seat-based ceiling.
| Test | Entered activity or cost | Monthly EBIT |
|---|---|---|
| Published reference | 100 guests per trading day | $3,812 |
| 20% less earned activity | 80 guests per trading day | -$4,841 |
| 10% higher wage benchmarks | 1.10 × the same occupational wage anchors | $1,100 |
| 20% higher occupancy cost | $7,200.00 monthly occupancy | $2,612 |
Of the three separate tests shown, 20% less earned activity makes the largest change to monthly EBIT: -$8,653. This is a result of the stated test sizes, not a probability or a universal risk ranking.
The roster pays management, cooking, counter service and dishwashing. Reconcile preparation, receiving, service, breaks and closing to those same hours; extending service hours changes the roster rather than creating free capacity.
Opening payments of $200,364, the deepest cumulative operating cash deficit of $41,612 in month 4, and the retained buffer of $73,237 add to $315,213 modeled funding. Refundable deposits are included in opening cash uses; they are not operating expenses. Funding is a scenario total, not a quote or a financing recommendation.
Prompt meal collections do not repay fit-out at opening. Food and training are paid before stable trade, while depreciation changes EBIT without itself being a monthly cash payment.
EBITDA pays the full modeled roster and operating costs. EBIT also deducts depreciation. Mature cash deducts maintenance investment from EBITDA, after receivables stop growing. All three exclude financing, income taxes and additional owner distributions.
A service period that cannot reach its contribution requirement within the tested kitchen and paid roster calls for a narrower menu, revised hours or another premises choice. Keep a paid-cover and recipe-contribution log for representative lunch and dinner services, then obtain an installed kitchen scope and address-specific premises terms.
The wage observation is the BLS May 2025 national occupational median for each stated role. Hours, employer allowance, sales, prices, capacity and all nonwage costs are authored assumptions. Read the calculation definitions.
Calculations retain the exact input values. USD totals are displayed to whole dollars and blended prices to cents; activity and threshold estimates are displayed to up to two decimals. Rounded thresholds are estimates, not prescriptions for a sufficient whole job, visit or member count.
Guests buy a prepared meal and a dining occasion. Count paid covers, distinguish lunch from dinner and measure the net check after discounts. A full room during one peak period does not fill the rest of the trading week.
Repeat visits depend on consistent food, service and a reason to return. Track repeat covers separately from first-time promotions; a discounted opening weekend is a weak basis for a normal month.
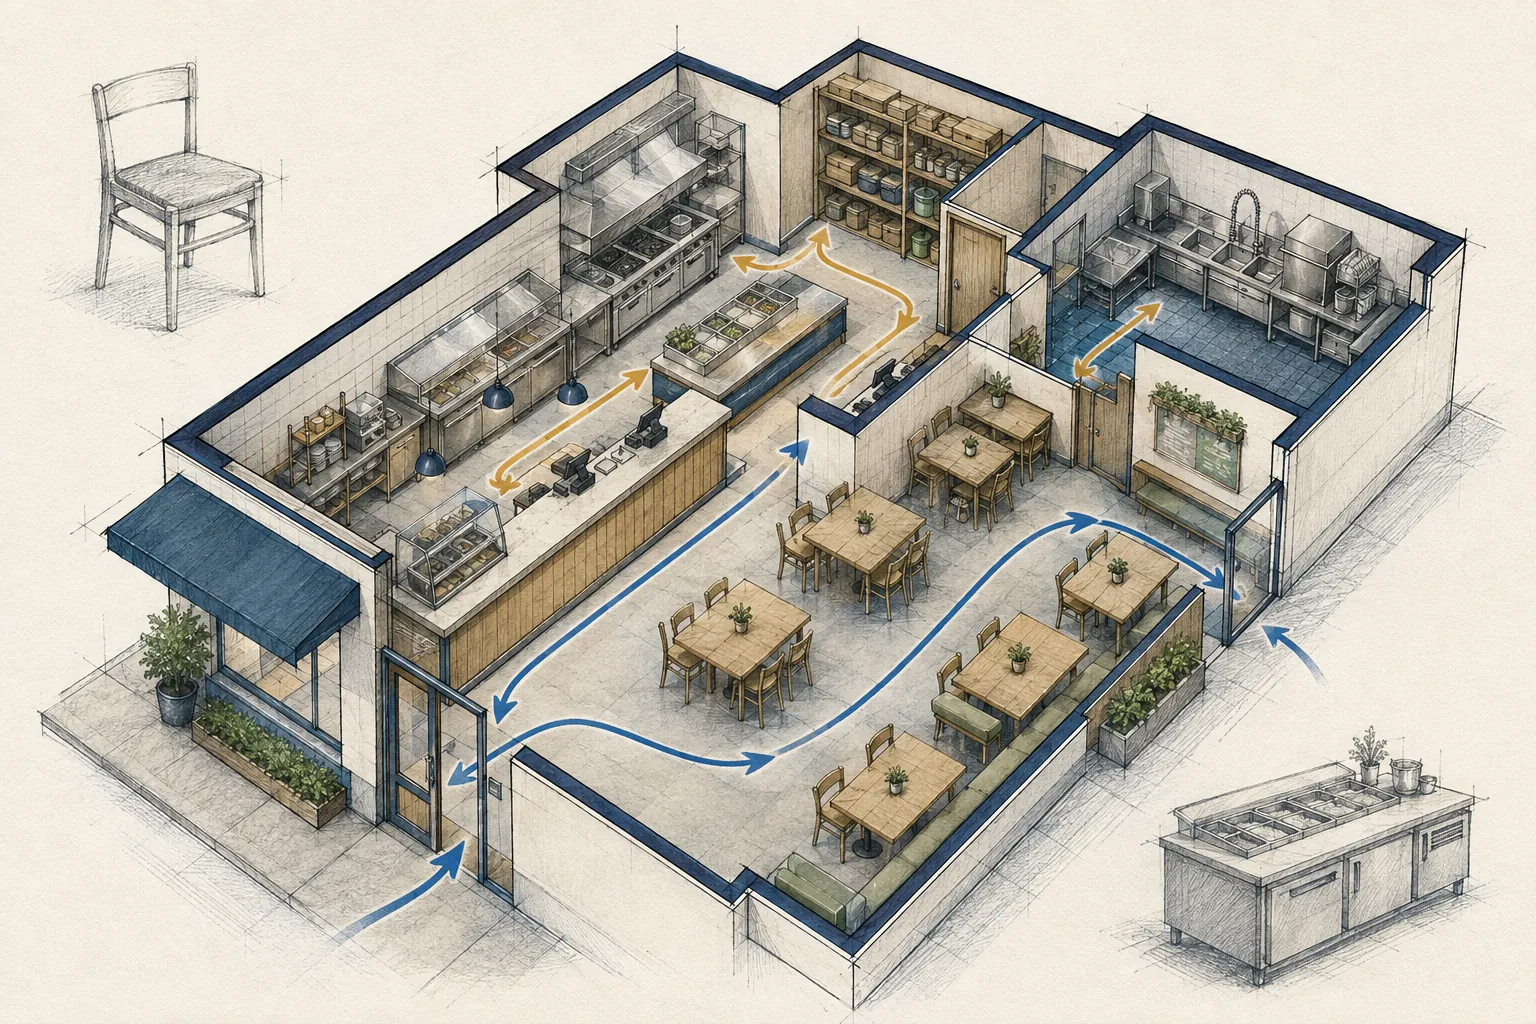
| Format | What changes | How to use it |
|---|---|---|
| 48-seat counter-service restaurant | Counter ordering, a dining room and a paid kitchen and service team | The reference used here; guest turns and kitchen output both constrain covers. |
| Full-service dining | Table service and a different staffing and guest experience | Requires its own ticket, paid roster, service cycle and collection assumptions. |
| Pop-up or shared kitchen | Limited sessions or a booked production space | Useful for testing a menu; do not carry its rent or capacity into a permanent restaurant. |
A founder who wants to manage a team and a service operation, can work around trading peaks, and is prepared to resolve premises and food-production dependencies before opening.
The figures below are a national wage reference scenario. The paid roster uses May 2025 BLS national occupational medians. Prices, customer volume, rent, equipment and other commercial inputs are authored assumptions. This is not a researched average startup cost, owner-income promise or a funding recommendation.
| Input or result | Reference | What to verify |
|---|---|---|
| Completed sales units | 2,600 guests / month | 100 guests per trading day; demand requires evidence. |
| Net selling price | $26.00 | Build and test a relevant local menu, package or contract scope. |
| Revenue | $67,600 | Calculated volume × price, not observed sales. |
| Paid payroll | $27,119 / month | National wage medians × the stated hours × the 18% employer allowance. |
| Opening payments | $200,364 | Authored equipment and setup allowances, deposit and paid training. |
| Funding including reserve | $315,213 | Opening payments + deepest modeled operating deficit + retained buffer. |
| Mature operating profit (EBIT) | $3,812 / month | After the full paid roster and depreciation; before financing and income taxes. |
| Approximate EBIT threshold | Approximately 91.2 guests per trading day | A rounded estimate. Test whole permitted activity against the full roster and resource constraints. |
48 seats × 3 guest turns = 144 guests per day. This is a simplified service ceiling; kitchen throughput and table timing can reduce it.
32% ingredients and food waste plus 4% payment processing and packaging. Utilities $1,600; insurance $650; marketing $650; software, waste collection and other operating costs $600 per month.
Counter-service workers provide a broad service proxy. The roster uses no tipped-server credit. Hours are aggregate team coverage, not the schedule of one employee.
BLS May 2025 national wage workbook · Calculation definitions · How owner income differs from EBIT
| Workstream | What the brief needs | Decision before spending |
|---|---|---|
| Kitchen and fit-out | Menu, extraction, power, drainage, refrigeration and installation responsibilities | Confirm the proposed use and equipment layout before committing to a space. |
| Dining and service | Seats, tables, tableware, POS and a workable service route | Check the slowest station at the busiest service period. |
| Opening stock | A recipe-based ingredient list, shelf life and reorder quantities | Do not buy a large range before the opening menu is fixed. |
Compare installed scope, exclusions and payment dates. Do not treat an unquoted item as zero or count a bundled installation twice. How to compare equipment quotes and build the opening budget explains a reusable quote ledger.
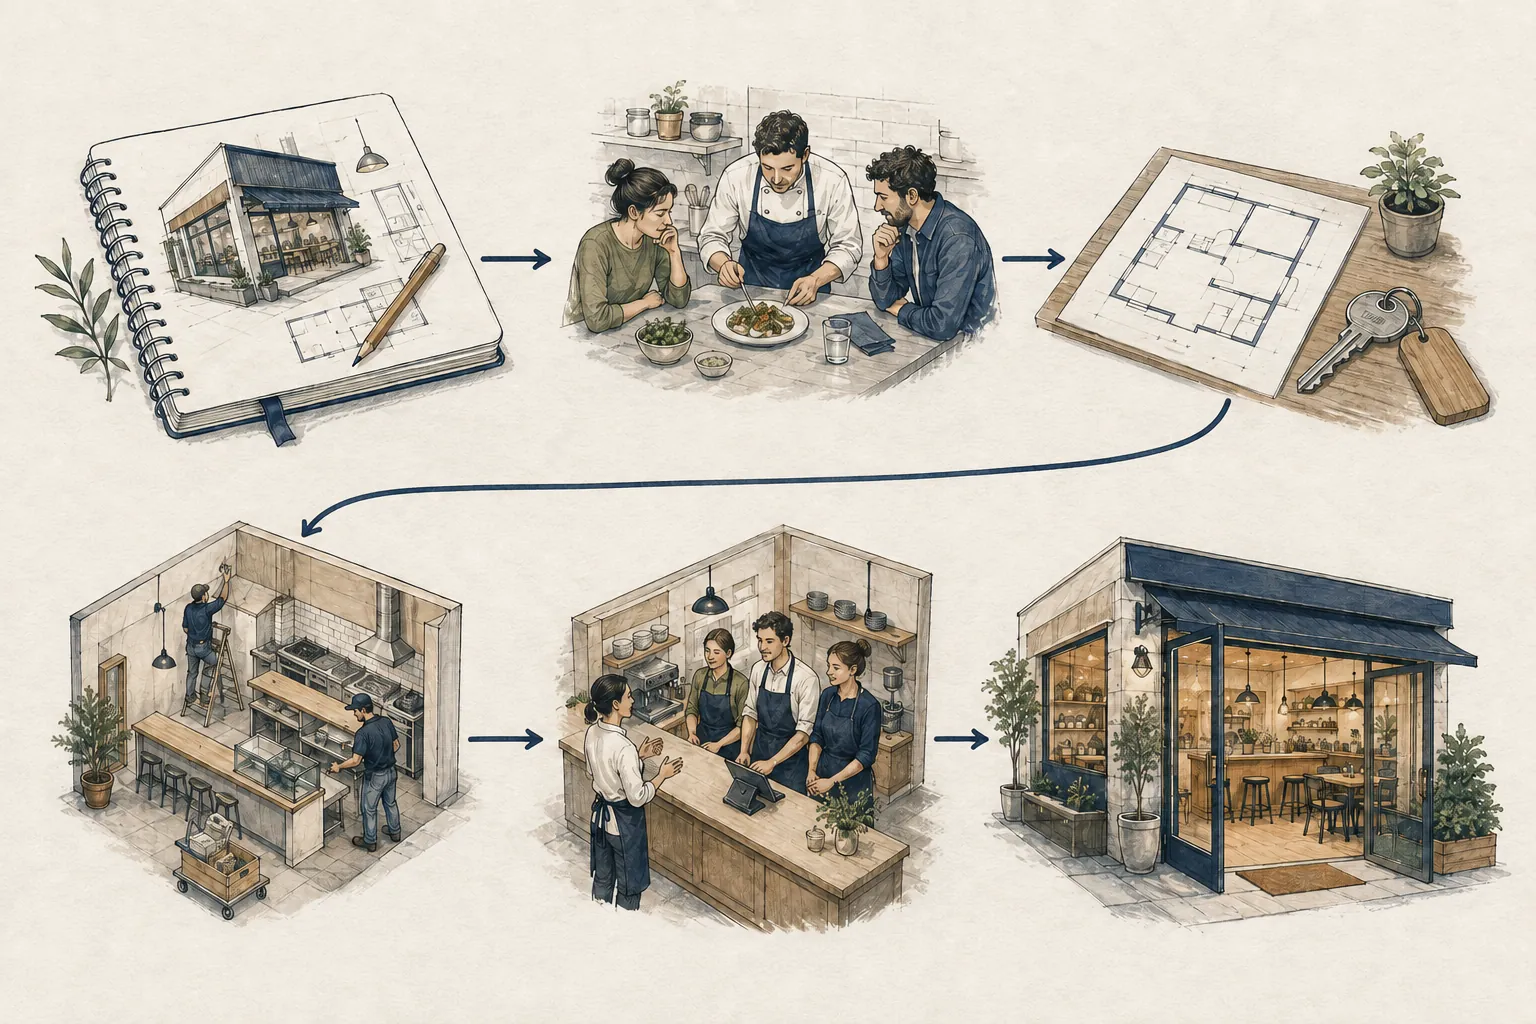
Run a legal, appropriately permitted test of the menu and service flow. Record paid covers, preparation minutes, waste and realized ticket. Capture the conditions that made the test possible.
Take the actual menu and equipment schedule to the relevant planning, food and building authorities. Obtain written answers on permitted activity and work required; a previous food tenant is not approval for your plan.
Build opening, preparation, service and closing rosters. Price the ingredients by recipe and calculate whether each trading period contributes enough to carry its paid labor.
Practice a complete shift, count inventory and test supplier ordering, payment settlement and closing controls. Expand hours or menu items only when the team can deliver them consistently.
| Measure | Why it changes a decision |
|---|---|
| Paid covers by service | Separates an unfilled lunch period from a capacity problem at dinner. |
| Net check and recipe contribution | Shows whether menu mix, discounts or ingredient changes erased the apparent margin. |
| Paid labor hours per cover | Includes preparation, closing and management, not only the visible dining shift. |
| Waste and stock movement | Connects buying decisions to cash tied up and food that cannot be sold. |
Review actuals against the scope you priced. If an extra service, new trading hour or more distant client changes the work, update the roster and contribution calculation before expanding.
Bring the menu, preparation methods, floor plan, proposed equipment, seating and any alcohol service to the address-level review. Ask which food, building, fire and other approvals apply and what must happen before construction and trading.
Each state profile links to official registration, tax and employer routes, together with the questions still requiring an address-specific answer. How to find the permits and approvals your business actually needs provides the record to keep.
A lease that depends on unconfirmed kitchen work, a menu with too many preparation paths, or a forecast that needs every seat occupied throughout service is a reason to redesign before spending more.
Write a response that changes the actual cause: narrower scope, a different site, revised paid staffing, a tested price or a delayed opening. A larger cash buffer only addresses a temporary timing gap.
Connect recipe cost, sales mix and preparation workload, then identify whether the planned menu fits the available service window.
Work through the guide →Compare total occupancy cash, upfront commitments and site dependencies using a worked premises budget and a practical review record.
Work through the guide →Account for service, setup, cleaning, travel and owner work, then turn a complete paid week into a monthly staffing budget.
Work through the guide →Create a weekly receipts-and-payments forecast, locate the cash low point and test late collections using an editable 13-week schedule.
Work through the guide →Choose between a meal-led service operation and a habit-led counter operation. The counter-service restaurant reference must coordinate menu production, guest ordering and dining space; a coffee shop must win repeat transactions and deliver them quickly in its buying windows.
Compare the operating choices →This is a choice between serving customers at a fitted destination and delivering a recurring service across client sites. The restaurant depends on its address and meal-period trade; cleaning depends on measured contracts, route density and consistent delivery.
Compare the operating choices →A restaurant coordinates a team around meal periods; a hair salon schedules skilled service time around appointments. Both use fitted premises, but the salon’s service duration and kept bookings play the role that menu production and paid covers play in a restaurant.
Compare the operating choices →Restaurant trade is organized around meal periods and a food-service team. A detailing studio is organized around vehicle packages, technician-hours and available bays. The second format’s smaller number of daily jobs makes job scope and duration especially consequential.
Compare the operating choices →A restaurant coordinates food production and guest service; a laundromat coordinates an equipment-heavy site around paid machine turns. Both depend on a suitable address, but the critical technical and customer evidence is different.
Compare the operating choices →A restaurant converts meal-period transactions through a food-production and service system. A daycare center converts reserved child-weeks into revenue while maintaining qualified room coverage throughout a long care day.
Compare the operating choices →A restaurant earns meal-period transactions through food production and service. A pet grooming salon earns completed dog appointments whose paid labor and station time change with the service cohort. Both need fitted premises, but the site systems and completion risks differ.
Compare the operating choices →A restaurant concentrates food production and guest service at one fitted premises. A landscaping company sends two paid crews through recurring residential routes. Both need a complete paid operating day, but one is constrained by meal-period stations and the other by route time, property scope, weather and equipment mobility.
Compare the operating choices →Both formats prepare food through a paid team, but a restaurant concentrates production and service in one fitted premises while a Food Truck moves one constrained kitchen among approved service locations. The truck replaces dining-room work with commissary, vehicle, route and vending-window dependencies.
Compare the operating choices →A Restaurant produces meals around immediate guest-service peaks. A Bakery starts production earlier, moves whole batches through shared equipment and must sell finished goods before freshness loss. Both need fitted food premises and a paid team, but their production and demand clocks differ.
Compare the operating choices →A Restaurant earns from completed guest transactions during food-service periods. A Fitness Studio earns recurring member-months while delivering scheduled instructor-led access. Both coordinate a paid team and fixed premises, but meals are consumed per visit while studio value depends on retention and repeat access across the month.
Compare the operating choices →A Restaurant earns many guest transactions through one fitted food-service site. An HVAC Company earns from scheduled field work across customer addresses, with service-call and equipment-replacement economics kept separate. Both coordinate paid labor and costly equipment, but the restaurant carries daily premises trade while HVAC carries vehicles, travel, parts cash, technical authorization, and callback responsibility.
Compare the operating choices →A Restaurant earns many guest transactions through one fitted food-service site. A Moving Company earns from fewer scheduled household projects using one truck and one paid crew across origin and destination addresses. Both coordinate paid labor and equipment, but the restaurant carries daily premises throughput while moving carries route, access, custody, claims, and job-duration risk.
Compare the operating choices →A Restaurant earns from many guest transactions through kitchen, counter, and seating capacity. An Auto Repair Shop earns from fewer completed repair orders through sold technician hours, parts, bays, and customer vehicle custody. Both depend on fitted premises and paid labor, but their direct inputs, cycle times, safety controls, and quality recovery differ.
Compare the operating choices →A Restaurant earns from completed guest orders through kitchen, service, and seating throughput. A Plumbing Company earns from completed and collected residential service jobs through licensed plumbers, two vehicles, dispatch, materials, permits, and callback control. Both must fit paid capacity to realized contribution, while plumbing adds address-to-address travel, trade authority, water and gas system risk, material acquisition, and return-service exposure.
Compare the operating choices →A Restaurant earns from completed guest orders through kitchen, service, and seating throughput. An Electrical Contractor earns from completed and collected residential service and small-alteration jobs through licensed electricians, two vehicles, dispatch, sold hours, materials, permits, inspections, testing, and rework control. Both must fit paid capacity to realized contribution, while electrical adds address-to-address travel, trade authority, code and energized-work risk, material compatibility, inspection dependencies, and return-service exposure.
Compare the operating choices →Restaurant earns from completed guest orders and is constrained by kitchen, service, and seating throughput. Pest Control Company earns a monthly household-plan yield while delivering a separate calendar of inspections, initial visits and callbacks. Compare realized contribution and paid capacity in their own units; a pest contract base is useful only when retention, legal scope and route obligations remain deliverable.
Compare the operating choices →Restaurant earns from paid guest covers and realized meal check and is constrained by kitchen stations, paid preparation, service peaks and guest handling. Residential Remodeling Company earns accepted interior scope, expressed as comparable project equivalents, while controlling a paid carpenter crew and authorized specialty trades. Compare the complete paid operating mechanism and dated cash, using each format’s own unit.
Compare the operating choices →A smaller dining room can reduce some setup needs, but the kitchen, preparation work and minimum staffing may not shrink in proportion. Test the full operating week at the proposed capacity.
An owner may defer a withdrawal, but their operating work still needs a replacement cost in a comparable business plan. This reference pays every role and separates owner withdrawals from EBIT.
No. The range on this site mainly changes with wage benchmarks. Obtain premises, construction and equipment scopes for the actual address before estimating a local funding requirement.
No states match these filters.
Sorting compares one defined format. It does not rank states for attractiveness or prove demand. Funding includes opening payments, the deepest cumulative operating cash deficit in the 60-month model and the retained cash buffer.
| State | Funding scenario | Loaded payroll / month | Approximate EBIT threshold guests per trading day |
|---|---|---|---|
| Alabama | $291,120 | $22,799 | 81.2 |
| Alaska | $329,765 | $29,393 | 96.4 |
| Arizona | $322,236 | $28,252 | 93.8 |
| Arkansas | $286,900 | $21,987 | 79.3 |
| California | $355,052 | $32,739 | 104.2 |
| Colorado | $339,151 | $30,697 | 99.5 |
| Connecticut | $330,760 | $29,531 | 96.8 |
| Delaware | $319,787 | $27,856 | 92.9 |
| Florida | $311,040 | $26,445 | 89.6 |
| Georgia | $301,311 | $24,760 | 85.7 |
| Hawaii | $350,035 | $32,127 | 102.8 |
| Idaho | $307,394 | $25,857 | 88.3 |
| Illinois | $317,112 | $27,425 | 91.9 |
| Indiana | $305,777 | $25,596 | 87.7 |
| Iowa | $303,270 | $25,137 | 86.6 |
| Kansas | $302,695 | $25,026 | 86.4 |
| Kentucky | $302,177 | $24,926 | 86.1 |
| Louisiana | $283,821 | $21,395 | 78 |
| Maine | $334,293 | $30,022 | 97.9 |
| Maryland | $320,996 | $28,052 | 93.3 |
| Massachusetts | $354,589 | $32,682 | 104 |
| Michigan | $303,746 | $25,228 | 86.8 |
| Minnesota | $323,022 | $28,378 | 94.1 |
| Mississippi | $283,157 | $21,267 | 77.7 |
| Missouri | $309,068 | $26,127 | 88.9 |
| Montana | $311,349 | $26,495 | 89.7 |
| Nebraska | $302,761 | $25,039 | 86.4 |
| Nevada | $315,680 | $27,194 | 91.4 |
| New Hampshire | $324,875 | $28,677 | 94.8 |
| New Jersey | $327,259 | $29,045 | 95.6 |
| New Mexico | $302,836 | $25,053 | 86.4 |
| New York | $341,984 | $31,091 | 100.4 |
| North Carolina | $308,069 | $25,966 | 88.5 |
| North Dakota | $310,396 | $26,341 | 89.4 |
| Ohio | $301,392 | $24,775 | 85.8 |
| Oklahoma | $289,708 | $22,528 | 80.6 |
| Oregon | $325,654 | $28,803 | 95.1 |
| Pennsylvania | $304,018 | $25,281 | 86.9 |
| Rhode Island | $321,924 | $28,201 | 93.7 |
| South Carolina | $301,919 | $24,877 | 86 |
| South Dakota | $301,530 | $24,802 | 85.8 |
| Tennessee | $302,649 | $25,017 | 86.3 |
| Texas | $298,494 | $24,218 | 84.5 |
| Utah | $308,069 | $25,966 | 88.5 |
| Vermont | $342,220 | $31,123 | 100.4 |
| Virginia | $312,599 | $26,697 | 90.2 |
| Washington | $407,338 | $34,035 | 107.2 |
| West Virginia | $285,158 | $21,652 | 78.6 |
| Wisconsin | $301,958 | $24,884 | 86 |
| Wyoming | $302,145 | $24,920 | 86.1 |
Published research and calculations support business planning and education. They are not personalized financial, investment, tax or legal advice, and they do not guarantee costs, revenue, profit or financing. Estimates depend on the stated format, location, source periods and assumptions. Check the requirements and commitments that apply to your circumstances.